Quantcast
Channel: ScyllaDB
Viewing all 937 articles
Browse latest View live

Scylla Manager 1.2 Release Announcement

$
0
0

The Scylla Enterprise team is pleased to announce the release of Scylla Manager 1.2, a production-ready release of Scylla Manager for Scylla Enterprise customers.

Scylla 1.2 focuses on a better control of repair tasks scope, allowing users to run repairs on a subset of Data Centers (DC), keyspaces, and tables, easier deployment, and setup, and improvements in security.

Related links:

Upgrade to Scylla Manager 1.2

Read the upgrade guide carefully. In particular, you will need to redefine scheduled repairs. Please contact Scylla Support team for help in installing and upgrading Scylla Manager.

New features in Scylla Manager 1.2

Debian 8 and Ubuntu 16 packages

Scylla Manager is now available for Debian 8 and Ubuntu 16, packages will be shared in the next few days.

Improved Repair Granularity

In previous releases, one could only use Scylla Manager to run a cluster-wide repair. Starting with Scylla Manager 1.2, scheduled and ad-hoc repairs can be limited to:

  • One or more DataCenters (DC), with --dc flag
  • One node (host) with --host flag
  • Repair with a subset of hosts with –with-hosts flag
  • Repair primary or non-primary token ranges with –token-ranges [pr|npr] flag
  • Keyspace (existed in Scylla Manager 1.1 with a different syntax)
  • Table (existed in Scylla Manager 1.1 with a different syntax)

For example, the above elements can be used to:

  • Run a local DC Repair
  • Repair a specific node, for example after a node restart
  • Repair only a restarted node, and all nodes with overlapping token ranges

For more on running a granularity repair see sctool 1.2 reference, and below on sctool updates

Sctool updates

  • You now need to provide only one node IP when adding a new cluster. For example
    sctool cluster add --host=198.100.51.11 --name=prod-cluster
  • New flags in sctool:
    • --dc, --host, --with-hosts, --token-ranges (see more granular repair above)
    • --fail-fast: Stops the repair process on the first error
  • sctool allows selecting multiple keyspace and table using glob pattern matching, For example:
  • Repair only US East DC:
    sctool repair --cluster mycluster --dc dc-us-east
  • Repair all US DCs, but US West:
    sctool repair --cluster mycluster --dc dc-us-*, !dc-us-west
  • Repair subset of Keyspaces:
    sctool repair --cluster mycluster -K mykeyspaces-*
  • Repair subset of Keyspaces: sctool repair
    --cluster mycluster -K mykeyspace
  • sctool task start: a new --continue flag allow resuming the task from where it last stopped, not from the start.

Security

  • One of the common problems with adding a managed Scylla cluster to Scylla Manager was the task of creating a scylla-manager user and sharing the Scylla Manager public key to all Scylla node. With Scylla Manager 1.2 this task is greatly improved with the introduction of the new scyllamgr_ssh_setup script.Read more about the new script and how to manage a new cluster with Scylla Manager 1.2
  • Two optional new parameters for sctool command ‘cluster add’: ssh-user and ssh-identity-file, allow you to specify a different SSH key and user per cluster
  • Scylla Manager now uses HTTPS by default to access with Scylla nodes REST API. Note that Scylla REST API is still bound to a local IP only, and Scylla Manager uses SSH to connect to the node.

Monitoring

Scylla Grafana Monitoring 2.0 now includes Scylla Manager 1.2 dashboard

The following metrics have been updated in Scylla Manager 1.2

  • Total run tasks metrics definition have changed the name from “status_total” to “run_total”
  • In subsystem “repair” “unit” has changed the name to “task”
  • In subsystem “repair” “keyspace” has been added

The following metric has been removed in Scylla Manager 1.2

  • Subsystem “log” has been removed

About Scylla Manager

Scylla Manager adds centralized cluster administration and recurrent task automation to Scylla Enterprise. Scylla Manager 1.x includes automation of periodic repair. Future releases will provide rolling upgrades, recurrent backup, and more. With time, Scylla Manager will become the focal point of Scylla Enterprise cluster management, including a GUI frontend. Scylla Manager is available for all Scylla Enterprise customers. It can also be downloaded from scylladb.com for a 30-day trial.

The post Scylla Manager 1.2 Release Announcement appeared first on ScyllaDB.


Scylla Summit Preview: Rebuilding the Ceph Distributed Storage Solution with Seastar

$
0
0
Scylla Summit Preview: Rebuilding the Ceph Distributed Storage Solution with Seastar
In the run-up to Scylla Summit 2018, we’ll be featuring our speakers and providing sneak peeks at their presentations. This interview in our ongoing series is with Kefu Chai, Software Engineer at Red Hat. Before Red Hat Kefu has worked at Morgan Stanley, VMWare, and EMC. His presentation at Scylla Summit will be on Rebuilding the Ceph Distributed Storage Solution with Seastar.

We’d like to get to know you a little better, Kefu. Outside of technology, what do you enjoy doing? What are your interests and hobbies?

I try to teach myself French in my spare time. And I read sci-fi and play FPS video games sometimes when I am tired of memorizing conjugations. 😃

You have broad experience developing kernel modules, client-side applications, middleware, testing frameworks and HTTP servers. What path led you to getting hands-on with Seastar?

Higher throughput, more IOPS and predictable lower latency have become the “holy grail” of storage solutions. The words sounds familiar to you, right? Because database and storage systems share almost the same set of problems nowadays. It’s natural for us to look for solutions in database technologies. And the Seastar framework behind Scylla is appealing. That’s why we embarked our journey rebuilding Ceph with Seastar

For those not familiar with Ceph, what are its primary features? How would you compare it to other storage options?

Ceph is an open-source distributed storage platform which offers block, object, and filesystem access to the data stored in the cluster. Unlike numbers, it’s often difficult to compare real-world entities. Even an apple could be very different from another apple in different perspectives. Instead, I’d like to highlight some things that differentiate Ceph from other software-defined storage solutions:

  • It has an active user and developer community.
  • It’s a unified storage solution. One doesn’t need to keep multiple different clusters for different use cases.
  • It’s designed to be decentralized and to avoid single point of failure.

What will you cover in your talk?

I will introduce Ceph the distributed storage we are working on, explain the problems we are facing, and then talk about how we rebuilt this system with Seastar.

Though you are sure to get into this deeper in your discussion, what advantages are you seeing in the Seastar framework?

As you might know, I was working on another C++ framework named mordor couple years ago before C++11 brought the future/promise to us. And all of mordor, C++11 and Seastar offer coroutine, such that by calling a blocking call, the library automatically moves another runnable fiber to this thread so this thread is not blocked. But Seastar went further by enforcing the share-nothing model with zero tolerance of locking. I think this alone differentiates Seastar from other coroutine frameworks. It forces developers to re-think their designs.

What were some unique challenges to integrate Seastar to Ceph?

Unlike some other projects based on Seastar, Ceph was not designed from scratch with Seastar. So we need to overcome some more interesting difficulties. Also, Ceph is a very dynamic project, so it’s like trying to catch a guy ten miles ahead running away from you.

Where are you in the process of integration?

What are you looking to do next? We are rebuilding the infrastructures in Ceph using Seastar. It’s almost done. We want to get to the I/O path as soon as possible to understand how Seastar impacts to the performance. Is there anything Scylla Summit attendees need to know in order to get the most out of your talk? What technology or tools should they be familiar with? It would be ideal if the attendees have basic understanding of typical threading model used by servers. But I will cover this part briefly also.

Thank you for the time Kefu! Looking forward to seeing you on stage in November!

If you haven’t arranged your own travel plans to attend Scylla Summit 2018, it’s not too late! Don’t delay! Register today!

The post Scylla Summit Preview: Rebuilding the Ceph Distributed Storage Solution with Seastar appeared first on ScyllaDB.

Scylla Summit Preview: Grab and Scylla – Driving Southeast Asia Forward

$
0
0

Scylla Summit Preview: Grab and Scylla - Driving Southeast Asia Forward

In the run-up to Scylla Summit 2018, we’ll be featuring our speakers and providing sneak peaks at their presentations. This interview in our ongoing series is with Aravind Srinivasan, Staff Software Engineer of Grab, Southeast Asia’s leading on-demand and same-day logistics company. His presentation at Scylla Summit will be on Grab and Scylla: Driving Southeast Asia Forward.

Aravind, before we get into the details of your talk, we’d like to get to know you a little better. Outside of technology, what do you enjoy doing? What are your interests and hobbies?

I love hiking and biking. But now my (and my wife’s) world revolves around our 2 year old son who keeps us busy. 😃

How did you end up getting into database technologies? What path led you to getting hands-on with Scylla?

I started my career working on filesystems (for Isilon systems — now EMC/Dell) and so was always close to storage. After I decided to get out of the Kernel world and into the services world and moved to Uber, I was fortunate to work for a team which was building a queueing system from scratch where we used Cassandra as our metadata store, which worked ok for a while before we ran into lots of operational headaches. After I moved away from Uber and joined Grab to the Data Platform team, we needed a high-performing, low-overhead metadata store and we bumped into ScyllaDB at that point and that’s where we started our relationship with ScyllaDB.

What will you cover in your talk?

This talk will give an overview of how Grab uses ScyllaDB, the reason we chose ScyllaDB over others for the use cases and our experience so far with ScyllaDB.

Can you describe Grab’s data management environment for us? What other technologies are you using? What does Scylla need to connect and work with?

First and foremost Grab is an AWS shop but our predominant use case for ScyllaDB is with Kafka, which is the ingestion point for ScyllaDB. A couple of use cases also has a Spark job which talks to ScyllaDB directly. 

What is unique about your use case?

The most unique characteristic of our use case is the scale up pattern of the traffic volume (TPS). Generally the traffic volume (TPS) just hikes up and so a store which we use for our use case should be able to scale fast and should have the ability to handle bursts.

Is there anything Scylla Summit attendees need to know in order to get the most out of your talk? What technology or tools should they be familiar with?

Kafka, Stream Processing and some terminologies like TPS, QPS, p99 and other stats.

Thanks, Aravind. By the way, that seems like a perfect segue to highlight that we will have Confluent’s Hojjat Jafarpour talking about Kafka.

If you are interested in learning more about how Grab scaled their hypergrowth across Asia, make sure you register for Scylla Summit today!


The post Scylla Summit Preview: Grab and Scylla – Driving Southeast Asia Forward appeared first on ScyllaDB.

Scylla Summit Preview: Scylla: Protecting Children Through Technology

$
0
0
Scylla Summit Preview: Scylla: Protecting Children Through Technology

In the run-up to Scylla Summit 2018, we’ll be featuring our speakers and providing sneak peeks at their presentations. This interview in our ongoing series is with Jose Garcia-Fernandez, Senior Vice President of Technology at Child Rescue Coalition, a 501(c)(3) non-profit organization. His session is entitled Scylla: Protecting Children through Technology.

Jose, it is our privilege to have you at Scylla Summit this year. Before we get into the work of the Child Rescue Coalition, I’d like to know how you got on this path. What is your background, and how did you end up working on this project?

I have been developing software solutions for many years. I hold a Master in Computer Science and I work on software solutions in the areas of Big Data, Computer Networks and Cyber Security. I am responsible for the development, operation, and enhancement of the tools that makes CRC’s “Child Protection System” (CPS). CPS is the main tool thousands of investigators, on all U.S. states, and more than 90 countries, use in a daily basis to track, catch, and prosecute online pedophiles who use the Internet to harm children.

I started this path when I was working developing TLOXp, an investigative tool that fusions billions of records about people and companies for investigative purposes. About 10 years ago, a group of investigators showed us how pedophiles were using the Internet to harm children. I was shocked to know that the same power we use in a daily basis to share information, connect with other people on social media, and all benefits we have from using the Internet, was also used by pedophiles to communicate, share illegal material, mentor each other, and, the worst of all, contacting new victims in a way that was not possible before. We worked together, and, as a result of that work, we developed a set of tools for Law Enforcement, and they have been using them successfully over the last years to catch online child predators. More than a thousand kids have been rescued, and 10,000 pedophiles have been prosecuted, as a direct consequence of the use of the tools we created and maintain at CRC, along with the extraordinary work of committed law enforcement investigators. In 2014, that platform and the people involved on the project created Child Rescue Coalition in order to further grow the platform and expand its reach to other countries.

For those not familiar with your work, can you describe the challenge and the goals of the Child Rescue Coalition, and the technology you are using to address the problem?

Child Rescue Coalition’s mission is to protect children by developing online state-of-the-art technology. We deal with more than 17 billion records, we combine them into target reports, ranked them using several algorithms developed with law enforcement organizations and provide, through a web-based application, free of charge, to law enforcement agents, ranked targets in their respective jurisdictions. Technology comes in different tools for different purposes, we deal with a lot of open-source product as well as proprietary technology to deal with big distributed systems.

In human terms, what is the scale of this issue?

People may not know of bad the problem is. We have programs called “bots” or “crawlers” on the Internet. These programs identify and send events informing about illegal activity to our servers. We deal with more than 50 million leads per day. Every year, we identify more than 5 million computers generating those leads, in other words, this means, millions of pedophiles looking for ways to victimize children.

Let me quote you this statement: “This tool stores several billions of records in Scylla, and it is expected to grow in the tens of billions of records in the near future.” That’s a shocking thing to imagine; just the raw quantity of data. What are the main considerations you face in managing it?

Our main consideration, and the reason why we selected Scylla, was its efficient and optimized design for modern hardware. This means, we can implement our solution with only 5 servers, but it would have required at least 20 servers using other technologies based on JVM. Having less servers mean lower hardware costs, but, more importantly, less time maintaining server failures, and more time for developing new projects. That also means we can horizontally scale as needed, with almost no impact.

Besides Scylla, what other technologies are critical to your mission’s success?

In order to grow we have been working towards making our platform more flexible, efficient and scalable. Recently, we have implemented Kubernetes to containerize ours tools and expand into the cloud. We have implemented Kafka and Apache NiFi for the expanding our data flow to new sources and processing with minimum impact, and standardizing to ScyllaDB for NoSQL storage for all the new tools.

Child Rescue Coalition is constantly sharing information about potential and actual crimes involving minors. Data privacy, retention and governance must be paramount. What special considerations do you have in that regard?

Our systems have been challenged over the years in court, and time after time we have proven, even with independent third-party validators, that our tools do not invade privacy, or use any nefarious or invasive ways to obtain the information we gather, or the processes law enforcement used with our tools were appropriate.

How can readers help if they want to support the Child Rescue Coalition?

We are a 501(c)(3) non-profit organization, meaning all received donations or funding could be tax-deductible. At the individual level, the easiest way is to become a coalition club member or make your contributions using this page: https://childrescuecoalition.org/donate/

Corporations can also become corporate sponsors, and/or fund specific projects or activities, or donate hardware, software, or services.

All funds are used primarily bring awareness, training and certification of new investigators on the use of our tools, at no cost, on underserved communities. Funds are also use for development and maintenance of new software as new online threads emerge. You can also follow us or find more about our organization on these links:

Thank you for all you do. Your session at the Scylla Summit will certainly be riveting.

The post Scylla Summit Preview: Scylla: Protecting Children Through Technology appeared first on ScyllaDB.

Scylla Manager — Now even easier to maintain your Scylla clusters!

$
0
0


Last week we announced the release of Scylla Manager 1.2, a management system that automates maintenance tasks on a Scylla cluster. This release provides enhanced repair features that make it easier to configure repairs on a cluster. In this blog, we take a closer look at what’s new.

Efficient Repair

Scylla Manager provides a robust suite of tools aligned with Scylla’s shard-per-core architecture for the easy and efficient management of Scylla clusters. Clusters are repaired shard-by-shard, ensuring that each database shard performs exactly one repair task at a time. This gives the best repair parallelism on a node, shortens the overall repair time, and does not introduce unnecessary load.

General Changes

In order to simplify configuration of Scylla Manager we have removed the somewhat confusing “repair unit” concept. This concept served only as a static bridge between what to do (“tasks”), and when to run them, and was thus unnecessary. A task is defined as the set of hosts, datacenters, keyspaces and tables on which to perform repairs. Essentially it boils down to what you want to repair. Which tasks it operates on exactly is determined at runtime. This means that if you add a new table that matches a task definition filter it will also be repaired by that task even though it did not exist at the time the task was added. This makes Scylla Manager simultaneously easier for users while making the Scylla Manager code simpler, which will also allow us to develop new features faster.


Scylla Manager Logical View

Multi-DC Repairs

One of the most sought-after features is to isolate repairs. Scylla Manager 1.2 provides a simple yet powerful way to select a specific datacenter or even limit which nodes, specific table, keyspace, or even token ranges are repaired.

You can furthermore decide with great precision when to perform repairs using timestamps and time deltas. For example, to repair all the shopping cart related tables in the Asian datacenter and to start the repair task in two hours, you would run a repair command such as this:

sctool repair -c 'cname' --dc 'dc_asia' --keyspace 'shopping.cart_\*' -s now+2h

This command issues repair instructions only to the nodes located in the datacenter dc_asia and repair only the tables matching the glob expression shopping.cart_*. This is a one time repair. To make it recurrent, use the --interval-days flag to specify the number of days between repair tasks. If you want to repair multiple keyspaces at a time, simply add another glob pattern in the --keyspace argument such as this:

sctool repair -c 'name' --dc 'dc_asia' --keyspace 'shopping.cart_\*,audit.\*' -s now+2h

This repairs all the tables in the audit keyspace as well in the same repair task. If you want to skip repairing one of the tables (audit.old, for example) just add the exclude command like this:

sctool repair -c 'name' --dc 'dc_asia' --keyspace 'shopping.cart_*,audit.\*,\!audit.old' -s now+2h

This repairs all tables in the “audit” keyspace except for the table named “old”.

If you want to further control what the repair should use as its source of truth, you can use the --with-hosts flag which specifies a list of hosts. This will instruct Scylla to use only these hosts when repairing, rather than all of them which is normally the case. To repair just a single host you can use the flag --host which is particularly useful in combination with --with-hosts since you can with minimal impact quickly repair a broken node.

By default Scylla Manager will instruct Scylla to repair “primary token ranges” which means that only token ranges owned by the node will be repaired. To change this behavior you can inverse it by simply adding the argument --npr or use --all to repair all token ranges.

A note on glob patterns…

We chose to use glob patterns, for example keyspace.prefix*, for specifying filters as they provide a high degree of power and flexibility without the complexity of regular expressions which can easily lead to human errors. These patterns easily allow you to specify several keyspaces and tables without writing out all of them in a list which can be quite tedious in a large application with lots of different data types.

Simplified Installation

Scylla Manager uses the Scylla REST API for all of its operations. Scylla Manager supports SSH tunneling for its interactions with the Scylla database nodes for increased security. It is not mandatory to do so, but we recommend using SSH tunneling because it does not require any changes to database configuration, and be implemented with a dedicated low-permission user. It also does not need any special software installed on the database machines. This simplifies operations since there is nothing extra to monitor, update, and otherwise manage. The concept of having a companion application installed together with another main application is known as a “sidecar.” We do not believe sidecars to be a good design pattern for Scylla Manager, since this bring additional operational burdens.

In Scylla Manager 1.2, we have made it very easy to setup the SSH connectivity for the Scylla Manager to talk to the Scylla database nodes.

One thing many users reported as being troublesome was the generation and distribution of the SSH keys necessary for this to work. To solve this problem , we have now added the scyllamgr_ssh_setup script that is available after you install Scylla Manager. This script does not simply copy key files, but discovers all the nodes in a cluster for every node sets up the proper user that is needed for the SSH connectivity to work.

To run the script, make sure there is an admin user who has root privileges so that the script can use these permissions to perform the setup. This power user is not remembered or reused in any way but is simply used to perform the needed administrative functions to setup the required user and keys. The admin user is much like the Amazon ec2-user. The script creates a user specified by the -m parameter that the Scylla Manager later uses for its SSH connection. This is a very restricted user as you cannot get shell access.

Generating and distributing the needed keys is as simple as:

scyllamgr_ssh_setup -u ec2-user -i /tmp/amazon_key.pem -m scylla-manager -o /tmp/scyllamgr_cluster.pem -d <SCYLLA_IP>

This generates or reuses the file: /tmp/scyllamgr_cluster.pem which is distributed to all of the nodes in the cluster. In order to do this, the script uses the Scylla REST API to discover the other members of the cluster and sets up the needed users and keys on these nodes as well. If you later add a node to the cluster, you can re-run the script for just that node.

Further improvements

  • HTTPS – By default, the Scylla Manager server API is now deployed using HTTPS for additional safety. The default port is 56443 but this can be changed in the config file /etc/scylla-manager/scylla-manager.yaml.
  • The SSH config is now set per cluster in the cluster add command. This allows a very secure setup where different clusters have their own keys.
  • The ssh configuration is now dropped and and any data available will be migrated as part of the upgrade.
  • cluster add is now topology aware in the sense that it will discover the cluster nodes if you just supply one node using the --host argument. There is no need to specify all the cluster nodes when registering a new cluster.
  • repair will obtain the number of shards for the cluster nodes dynamically when it runs so you do not need to know the shard count when you add the cluster. This can be very convenient in a cluster with different sized nodes.
  • Automated DC selection – Scylla Manager will ping the nodes and determine which DC is the closest and then use that for its interactions with the cluster whenever possible. The repair_auto_schedule task has been replaced by a standard repair task like any other that you might add.
  • The visual layout of the progress reporting in sctool is greatly improved.

The post Scylla Manager — Now even easier to maintain your Scylla clusters! appeared first on ScyllaDB.

The Dark Side of MongoDB’s New License

$
0
0
SSPL vs. APGL Side-by-Side

It’s never been simple to be an Open Source vendor. With the rise of the cloud and the emergence of software as a service, the open source monetization model continues to encounter risks and challenges. A recent example can be found in MongoDB, the most prevalent NoSQL OSS vendor, which just changed its license from AGPL license to a new, more-restrictive license called SSPL.

This article will cover why MongoDB made this change, and the problems and risks of the new model. We’ll show how SSPL broadens the definition of copyleft to an almost impossible extent and argue that MongoDB would have been better off with Commons Clause or just swallowed a hard pill and stayed with APGL.

Why a new license?

According to a recent post by MongoDB’s CTO, Elliot Horowitz, MongoDB suffers from unfair usage of their software by vendors who resell it as a service.

Elliot claims the AGPL clause that is supposed to protect the software from being abused in such a manner isn’t enough, since enforcing it would result in costly legal expenses.

As an OSS co-founder myself, these claims seem valid at first blush. Shouldn’t vendors and communities defend themselves against organizations that just consume technology without contributing anything back? How can an OSS vendor maintain a sustainable business and how can it grow?

As InfluxDB CTO Paul Dix said, someone needs to subsidize OSS, otherwise it cannot exist. There are cases where it’s being subsidized by a consortium of companies or foundations (Linux, Apache). There are cases where very profitable corporations (Google/Facebook), who rely on their profits from other business models, act as “patrons-of-the-arts” to open source code for various reasons — for instance, to attract top talent, to be considered a benevolent brand, or attract a large user base for their other proprietary products.

Pure OSS vendors are under constant pressure since their business model needs to subsidize their development and their margins are tight. Indeed, many OSS vendors are forced to an open core approach while they hold back functionality from the community (Cloudera), provide some of the closed-source functionality as a service (Databricks) or even making a complete U-turn, back to closed-source software (DataStax).

Could MongoDB and RedisLabs (who recently changed to AGPL+Commons Clause licensing) have found the perfect solution? These new solutions allow them to keep sharing the code while having an edge over opportunistic commercializers who take advantage of OSS with little to no contributions.

APGL vs. SSPL: A side-by-side comparison


APGL’s section 13 where “Remote Network Interaction” was totally replaced by SSPL’s limitations around “Offering the Program as a Service,” with completely new text therein.

SSPL requires that if you offer software as a service you must make public, open source, practically almost everything related to your service:

“including, without limitation, management software, user interfaces, application program interfaces, automation software, monitoring software, backup software, storage software and hosting software, all such that a user could run an instance of the service using the Service Source Code you make available.”

What’s the risk of SSPL?

From a 30,000 foot view, it might sound fair. Community users will be able to read the software, and use it for internal purposes, while usage that directly competes with the OSS vendor’s service model will be disallowed. Have your cake and eat it, too!

Have your cake and eat it too!

Hmmm… not so fast. Life, software and law aren’t so simple.

On the surface, the intention is good and clear, the following two types of OSS usage will be handled fairly well:

  1. Valid OSS internal usage
    A company, let’s call it CatWalkingStartup, uses MongoDB OSS to store cat walking paths. It’s definitely not a MongoDB competitor and not a database service, thus a valid use of the license.
  2. MongoDB as a service usage
    A company, let’s call it BetterBiggerCloud, offers MongoDB as a service without contributing back a single line of code. This is not a valid use according to SSPL. In such a case, BetterBiggerCloud will either need to pay for an Enterprise license or open all of their code base (which is less likely to happen).

Here’s where things get complicated. Let’s imagine the usage of a hypothetical company like a Twilio or a PubNub (these are just presented for example, this is not to assert whether they do or ever have used MongoDB). Imagine they use MongoDB and provide APIs on top of their core service. Would this be considered a fair usage? They do provide a service and make money by using database APIs and offering additional/different APIs on top of it. At what point is the implementation far enough from the original?

GPL and the Linux kernel used a cleaner definition where usage is defined as derived work. Thus, linking with the Linux kernel is considered derived and userspace programs are independent. There is a small gray area with applications that share memory between userspace and kernel, but, for the most part, the definition of what is allowed is well understood.

With the goal of closing the loophole with services, AGPL defined the term ‘Remote Network Interactions.’ The problem with SSPL is that there are only barely such boundaries. And now – users must share their backup code, monitoring code and everything else. It doesn’t seem practical and is very hard to defend on non trivial cases.

I wonder if folks at MongoDB have given this enough thought. What if a cloud service does not use the MongoDB query language and instead offers a slightly different interface to query and save JSON objects? Would it be allowed?

It's a mess! (A messy baby)

Should others follow SSPL?

In a word, no.

If you did intend to sell MongoDB as a service, you have to open source your whole store. It may be acceptable to smaller players but you wouldn’t find large businesses that will agree to this. It might as well just read, “You are not allowed to offer MongoDB as a service.”

MongoDB is foolishly overreaching.

The intent to control others offering MongoDB-as-a-[commercialized]-service is commendable. To desire to profit off your work when it is commercialized by others seems all well-and-good and Commons Clause takes care of it (although it expands beyond the limits of services). But let’s face it, there is nothing that unique about services; it’s more about commercializing the $300M investment in MongoDB.

I actually do not think this is MongoDB trying to turn itself into a “second Oracle.” I believe the intentions of MongoDB’s technical team are honest. However, they may have missed a loophole with their SSPL and generated more problems than solutions. It would have been better to use the existing OSS/Enterprise toolset instead of creating confusion. The motivation, to keep as much code as possible open, is admirable and positive.

This is, of course, not the end of open source software vendors. Quite the contrary. The OSS movement keeps on growing. There are more OSS vendors, one of whom just recently IPOed (Elasticsearch) and others on their way towards IPO.

While Open Source is not going away, the business models around it must and will continue to evolve. SSPL was a stab at correcting a widely-perceived deficiency by MongoDB. However, we believe there are better, less-burdensome ways to address the issue.

Disclosure: Scylla is a reimplementation of Apache Cassandra in C++. ScyllaDB chose AGPL for its database product for the very same reasons MongoDB originally chose AGPL. Our core engine, Seastar, is licensed under Apache 2.0

The post The Dark Side of MongoDB’s New License appeared first on ScyllaDB.

New Maintenance Releases for Scylla Enterprise and Scylla Open Source

$
0
0
Scylla Release

The Scylla team announces the availability of three maintenance releases: Scylla Enterprise 2018.1.6, Scylla Open Source 2.3.1 and Scylla Open Source 2.2.1. Scylla Enterprise and Scylla Open Source customers are encouraged to upgrade to these releases in coordination with the Scylla support team.

  • Scylla Enterprise 2018.1.6, a production-ready Scylla Enterprise maintenance release for the 2018.1 branch, the latest stable branch of Scylla Enterprise
  • Scylla Open Source 2.3.1, a bug fix release of the Scylla Open Source 2.3 stable branch
  • Scylla Open Source 2.2.1, a bug fix release of the Scylla Open Source 2.2 stable branch

Scylla Open Source 2.3.1 and Scylla Open Source 2.2.1, like all past and future 2.x.y releases, are backward compatible and support rolling upgrades.

These three maintenance releases fix a critical issue with nodetool cleanup:

nodetool cleanup is used after adding a node to a cluster, to clean partition ranges not owned by a node. The critical issue we found is that nodetool cleanup would wrongly erase up to 2 token ranges that were local to the node. This problem will persist if cleanup is executed on all replicas of this range. The root cause of the issue is #3872, an error in an internal function used by cleanup to identify which token ranges are owned by each node.

If you ran nodetool cleanup, and you have questions about this issue, please contact the Scylla support team (for Enterprise customers, submit a ticket; for Open Source users, please let us know via GitHub).

Related Links for Scylla Enterprise 2018.1.6

Related links for Scylla Open Source

Additional fixed issues in Scylla Enterprise 2018.1.6 release, with open source references, if they exist:

  • CQL: Unable to count() a column with type UUID #3368, Enterprise #619
  • CQL: Missing a counter for reverse queries #3492
  • CQL: some CQL syntax errors can cause Scylla to exit #3740#3764
  • Schema changes: race condition when dropping and creating a table with the same name #3797
  • Schema compatibility when downgrading to older Scylla or Apache Cassandra #3546
  • nodetool cleanup may double the used disk space while running #3735
  • Redundant Seastar “Exceptional future ignored” warnings during system shutdown. Enterprise #633 

Additional issues solved in Scylla Open Source 2.2.1:

  • CQL: DISTINCT was ignored with IN restrictions #2837
  • CQL: Selecting from a partition with no clustering restrictions (single partition scan) might have resulted in a temporary loss of writes #3608
  • CQL: Fixed a rare race condition when adding a new table, which could have generated an exception #3636
  • CQL: INSERT using a prepared statement with the wrong fields may have generated a segmentation fault #3688
  • CQL: failed to set an element on a null list #3703
  • CQL: some CQL syntax errors can cause Scylla to exit #3740#3764 – Performance: a mistake in static row digest calculations may have lead to redundant read repairs #3753#3755
  • CQL: MIN/MAX CQL aggregates were broken for timestamp/timeuuid values. For example SELECT MIN(date) FROM ks.hashes_by_ruid; where the date is of type timestamp #3789
  • CQL: TRUNCATE request could have returned a succeeds response even if it failed on some replicas #3796
  • scylla_setup: scylla_setup run in silent mode should fail with an appropriate error when mdadm fails #3433
  • scylla_setup: may report on “NTP setup failed” after successful setup #3485
  • scylla_setup: add an option to select server NIC #3658
  • improve protection against out of memory while which insert a cell to existing row #3678
  • Under certain, rare, circumstances a scan query can end prematurely, returning only parts of the expected data-set #3605

Additional issues solved in Scylla Open Source 2.3.1:

  • Gossip: non zero shards may have stale (old) values of gossiper application states for some time #3798. This can create an issue with schema change propagation, for example, TRUNCATE TABLE #3694
  • CQL: some CQL syntax errors can cause Scylla to exit #3740#3764
  • In Transit Encryption: Possible out of memory when using TLS (encryption) with many connections #3757
  • CQL: MIN/MAX CQL aggregates were broken for timestamp/timeuuid values. For example SELECT MIN(date) FROM ks.hashes_by_ruid; where the date is of type timestamp #3789
  • CQL: TRUNCATE request could have returned a succeeds response even if it failed on some replicas #3796
  • Prometheus: Fix histogram text representation #3827

The post New Maintenance Releases for Scylla Enterprise and Scylla Open Source appeared first on ScyllaDB.

Scylla Summit Preview: Scylla and KairosDB in Smart Vehicle Diagnostics

$
0
0
Scylla Summit Preview: Scylla and KairosDB in Smart Vehicle Diagnostics

In the run-up to Scylla Summit 2018, we’ll be featuring our speakers and providing sneak peeks at their presentations. This interview in our ongoing series is with two speakers holding a joint session: Scylla and KairosDB in Smart Vehicle Diagnostics. The first part of the talk will feature Brian Hawkins speaking on the time-series database (TSDB) KairosDB, which runs atop Scylla or Cassandra. He’ll then turn the session over to Bin Wang of Faraday Future (FF), who will discuss his company’s use case in automotive real-time data collection.

Brian, Bin, thank you for taking the time to speak with me. First, tell our readers a little about yourselves and what you enjoy doing outside of work.

Brian: I recently purchased a new house and I’m still putting in the yard so I don’t have the luxury of doing anything I enjoy.

Bin: I adopted a small dog. I enjoy taking my family out in the nature on the weekends.

Brian, people have been enthusiastic about KairosDB from the start. Out of the many time-series databases available, what do you believe sets it apart?

Brian: Time-series data is addicting, no matter how much you have you want more. One way were Kairos stands out is its ability to scale as you want to store more data. If you want to store 100 metrics/sec or 1 million metrics/sec Kairos can handle it.

Another way where Kairos is different is that it is extremely customizable with plugins. You can embed it or customize it to your specific use case.

Bin, I was curious. Had you looked at our 2017 blog or seen the 2018 webinar about using KairosDB with Scylla? If not, how did you decide on this path for implementation? How did you determine to use these two technologies together?

Bin: I didn’t see that webinar before I made this decision at the beginning of our project. We chose it since we need to write huge quantities of signals data into persistent storage for use later. Our usage is not only loading in module training, but also to load historical values by our engineering team.

So we decided to store them in Cassandra. After that we found Scylla, which is written in C++ and has much better performance than traditional Cassandra. We switched our underlayer DB to Scylla.

After running for some time, we found we used a lot of storage with plain signals storage and also there are much greater requirements with visualization of signals.

So next I looked at InfluxDB and Grafana. They are perfect for signal visualization, but InfluxDB doesn’t have the same performance as Scylla. My team uses a lot Scylla in our projects. I like it.

After that I found KairosDB. It is perfect for me: working on Scylla, having great performance, more efficient storage of signals, and can work with Grafana as signal visualization. So my final solution is Scylla, KairosDB and Grafana.

What is the use case for Scylla and KairosDB at Faraday Future? Describe the data you need to manage, and the data ecosystem Scylla/KairosDB would need to integrate with.

Bin: Well, as I described before, KairosDB is an interface of storage of the signals sent from FF vehicles. Each of vehicle uploading hundreds to thousands of signals each second. We created a pipeline from RabbitMQ to decoding in Spring Cloud and message queue of Kafka and store them in KairosDB and persistent into Scylla.

In the consumer side, we use Grafana for the raw signal visualization, use Spark for module training and data analysing, and use Spring Cloud for the REST APIs for UI. KairosDB and Scylla is the core persistence and data accessing interface of the system.

Brian, when you listen to developers like Bin putting KairosDB to the test in IoT environments, what do you believe are important considerations for how they manage KairosDB and their real-time data?

Brian: Make sure you scale to keep ahead of your data flow. Have a strategy for either expiring your data or migrating it as things fill up. A lot of users underestimate how much time-series data they will end up collecting. Also make sure each user that will send data to Kairos understands tag cardinality. Basically if a metric has too many tag combinations it will take a long time to query and won’t be very useful.

Thank you both for your time!

Speaking of time series, if you have the time to see a series of great presentations, it it seriously time to sign up for Scylla Summit 2018, which is right around the corner. November 6-7, 2018.

The post Scylla Summit Preview: Scylla and KairosDB in Smart Vehicle Diagnostics appeared first on ScyllaDB.


The Perfect Hybrid Cloud for IBMHAT

$
0
0

The acquisition of Red Hat by IBM caught many, including myself, by surprise. It’s not that such an option was never on the table. During the time I was at Red Hat (2008-2012) such ideas were tossed about. Funny to say, but in 2012 Red Hat seemed too expensive a play. Revenues rose sharply since, and so has the price.

Before we dive into whether this move will save IBM, let’s first tip our caps for Red Hat, one of the most important technology companies. Red Hat is an innovator of the open source business model. The leader of the free developer spirit. The altruistic fighting force of openness and innovation. Most open source vendors strove to achieve Red Hat’s success and we all look up to its purist attitude for open source.

Without Red Hat, the world would likely be in a different place today. We see Microsoft embracing Linux and joining the Open Innovation Network (OIN), of which Scylla is a proud member. Today Linux dominates the server world and many organizations have an open source strategy, but it was Red Hat that planted the seeds, nurtured them and proved the world they can be sold for profit.

Red Hat employees are strongly bound to their company by a force that’s hard to find in even the coolest, most innovative companies. Every business decision is subject to scrutiny along the lines of “What would the Shadowman have said about it?”

Je Suis Red Hat

It’s great IBM will allow Red Hat to continue as an independent business unit. The world needs Red Hat to continue to flourish. Eight percent of the Linux kernel code is developed by Red Hat. It used to be much more, but over time other companies joined in Linux’ success. Red Hat remains a leader in Kubernetes, OpenStack, Ansible and many, many other important projects, including my good old KVM hypervisor.

Let’s not forget, IBM is a big innovator, too, with a great legacy and great assets. People like to mock IBM as a slow-moving giant but let’s not forget that Watson AI led the industry, way before AI became widespread. IBM Z series has hardware instructions to x86 hypervisor hackery and IBM Power has 8 hyper threads per core.

IBM’s customer base is also huge. They sell to brick-and-mortar enterprises. If you visited the IBM THINK conference after an AWS re:invent, you would have been shocked by how different the audience is, mainly the age and the outfits.

It’s not yet clear how the two companies will integrate and work together. During my tenure at Red Hat we worked closely with IBM, who were the best technology partner, but it won’t be easy to merge the bottom-up approach at Red Hat with the top-down at IBM.

Hybrid cloud opportunity

The joint mission is to win the Hybrid cloud, a market anticipated to grow to nearly $100 billion by 2023. IBM has not become one of the three leading cloud vendors (a larger market, valued at over $186 billion today) so it seeks to win in an adjacent large market. Today, private data center spending is still significantly larger than the cloud. It won’t last forever but most companies rely on more than a single cloud vendor or have combined private and public cloud needs — and this is where IBMHAT should go.

The way to get there is not by lock-in (though they could, as, Power + RHEL + OpenShift + Ansible make a lot of sense) but the opposite. Customers should go to the IBMHAT offering in order to have choice and flexibility. Now, theoretically, Red Hat alone and IBM alone already have such assets. Openshift and ICP (IBM Cloud Private) offer such Kubernetes marketplace today.

What’s missing?

Unlocking the attractiveness of hybrid cloud is easier said than done. My take is that it’s not enough to simply have a rich marketplace. A set of the best-of-breed services should be there out of the box, exactly as users are used to finding these services on public clouds.

There should be one central authentication service, one location for billing and EULAs, out-of-the-box object store, out-of-the-box shared storage (EBS/PD/..), one security console, a unified key management solution, one relational database and one DynamoDB-style NoSQL database (ScyllaDB is shamelessly recommended), plus a container service that can run on-prem and on-cloud, serverless capabilities and so forth. Only once the base services are there, the market place comes into play.

They all need to be provided with the same straightforward experience and dramatically improved cost over public clouds. This is the recipe for winning: simple, integrated default applications offered at competitive price. Public cloud vendors are eating IT since they provide an amazing world of self-service, just a few clicks for bullet-proof functionality. That’s quite a high bar that so far was not matched by on-premise vendors, so truly, good luck IBMHAT.

How good can this opportunity be? Let’s take a look at the financials of all-in cloud company, such as a Snap, where 60% of their revenues are invested (lost) in provisioning their public cloud.

Snap earnings 2018-2018

Dropbox, on the other hand, moved from public cloud to its own data centers (a move you do only after you’ve reached scale) and have far better margins.

Dropbox Revenue vs. COGS 2015-2017

With an independant, lock-in free stack IBMHAT would be able to help customers make their own choices and even run the software on AWS bare metal i3.metal servers while having the ability to migrate at any given time.

Final thoughts

IBM does not live in a void. We may see EMC/Pivotal doing a similar move and, in parallel, the cloud vendors realizing they need to go for private cloud. Other Linux vendors, such as Suse and Canonical, may well be next.

The post The Perfect Hybrid Cloud for IBMHAT appeared first on ScyllaDB.

Scylla Summit Preview: Adventures in AdTech: Processing 50 Billion User Profiles in Real Time with Scylla

$
0
0
Scylla Summit Preview: Adventures in AdTech: Processing 50 Billion User Profiles in Real Time with Scylla

In the run-up to Scylla Summit 2018, we’re featuring our speakers and providing sneak peeks at their presentations. This interview in our ongoing series is with Ľuboš Koščo and Michal Šenkýř, both senior software engineers in the Streaming Infrastructure Team at Sizmek, the largest independent Demand-Side Platform (DSP) for ad tech. Their session is entitled Adventures in AdTech: Processing 50 Billion User Profiles in Real Time with Scylla.

Thank you for taking the time to speak with me. I’d like to ask you each to describe your journey as technical professionals. How did you each get involved with ad tech and Sizmek in particular?

Ľuboš: I worked for Sun Microsystems and later for Oracle on applications and hosts in datacenter management software and cloud monitoring solutions. I am also interested in making source code readable and easily accessible, so I am part of the {OpenGrok team.

I was looking for new challenges and the world of big data, artificial intelligence, mass processing and real-time processing were all interesting topics for me. AdTech is certainly an industry that converges all of them. So Sizmek was an obvious choice to fill in my curiosity and open new horizons.

Michal: Frankly, getting into AdTech was a bit of a coincidence in my case, since before Sizmek I joined Seznam, a media company not unlike Google in its offerings, but focusing only on the Czech market. I intended to join the search engine team but there was a mixup and I ended up in the ad platform team. I decided to stick around and soon, due to my expertise in Scala, got to work on my first Big Data project using Spark. With that, a whole new world of distributed systems opened up to me. Some time (and several projects) later, I got contacted by Rocket Fuel (now Sizmek) to work on their real-time bidding system. They got me with the much bigger scale of operations, with a platform spanning the whole globe. It was a challenge I gladly took.

Last year you talked about how quickly you got up and running with Scylla. “We picked Scylla and just got it done–seven data centers up and running in two months.” What have you been up to since?

Ľuboš: We took on a bigger challenge: replace our user profile store with Scylla. We knew back then it won’t be that easy, since it’s one of the core parts of our real-time infrastructure. A lot of flows depend on it and the hardware takes a significant amount of space in our datacenters.

Preparing a proof of concept, doing capacity planning, making sure all pieces will work as designed were all tasks we had to do. However, we were able to tackle most of the challenges with the help of the Scylla guys and we’re close to production now.

At the same time a similar task happened within our other department, where we replaced our page context proxy cache with Scylla. This task is mostly getting to production now.

How about data management? How much data do you store, and what do your needs look like in terms of growth over time? How long do you keep your data?

Ľuboš: Currently we store roughly 30G per node, part of it in ramdisk on a total 21 nodes across the globe. This data can grow up to 50G per node per design. TTL here depends on the use case deployed, but it’s from a few hours to 3 or 7 days. The recent use case going to production will store much more data directly on SSD disks and right now it’s on 175GB per node on 20 nodes around the world. We can grow up to 1.7TB. This storage is persistent. Michal will comment on upcoming profile store, which we will talk about in more detail on the Summit.

Michal: In terms of user profiles, we currently store about 50 billion records, which amounts to about 150TB of replicated data. It fluctuates quite a bit with increases for new enhancements and decreases due to optimizations, legislative changes, etc. We keep them for just a few months unless we detect further activity.

What about AdTech makes NoSQL databases like Scylla so compelling for your architecture?

Ľuboš: Read latency of Scylla is very good. Also bearing in mind the fit with SSDs, CPU and memory allocation, and ease of node and cluster management. Scylla seems to also nicely scale vertically.

Michal: We have a huge amount of data that needs to be referenced in a very short amount of time. There simply is no way to do it other than a distributed storage system like Scylla. No centralized system can keep up with that. Using the profile data, we can make complex decisions when selecting and customising ads based on the audience.

How is Sizmek setting itself apart from other AdTech platforms?

Ľuboš: Sizmek is a high-performance platform. That means that we deliver on the campaign promise and we deliver with high quality. Sizmek’s AI models combined with real-time adjustments are one of the best in targeting for programmatic marketing. Sizmek was named the best innovator in this space by Gartner, and lots of our features that make us different are well described on our blog, so look it up. It’s very interesting reading.

Michal: We think deeply about which ads to show to which person and in what context. Internet advertising tends to have sort of a stigma because users can get annoying ads that follow them around, are displayed in inappropriate places, multiple times, etc. Our dedicated AI team is constantly working on improvements to our machine learning models to ensure that this is not the case and every advertisement is shown at precisely the right time to precisely the right user to maximize the effect our client wants to achieve.

Tell us about the SLAs you have for real time bidding (RTB).

Ľuboš: Right now we have 4 milliseconds maximum, but 1-2 milliseconds is the usual, for the page context caching service. For the proxy cache use case we are on 10 milliseconds as maximum, but generally this is around 3 milliseconds. [Editor’s note: These times are at the database level.]

Michal: For each given bid request, our [end-to-end] response needs to come in 70 milliseconds. Any longer than that and our bid is discarded. We allocate no more than 60% of that time to the actual lookup, which can involve multiple profile lookups if they are part of a cluster, as well as the subsequent transformation of the returned result. All in all, Scylla is left with less than 10 milliseconds at best to complete the actual query.

Anything you’re especially looking forward to at this year’s Scylla Summit?

Ľuboš: Scyla 3.0, in-memory Scylla, Spark and Scylla debugging are on my list so far.

Michal: I am very interested to hear about the progress the Scylla team is making towards version 3.0. It is going to be a huge update with several features that we already plan to take advantage of. I am also looking forward to hearing from the other users of Scylla about all the different use cases they are using the technology on.

Thank you both for this glimpse into your talk! I am sure attendees are going to learn a lot.

This is it! Scylla Summit is coming up next week. The Pre-Summit Training is Monday, November 5, followed by two days of sessions, Tuesday and Wednesday, November 6-7, 2018. Thank you for following our series of Scylla Summit Previews. We’re now busily preparing and look forward to seeing all of you at the show. So if you haven’t registered yet, now’s your chance.

The post Scylla Summit Preview: Adventures in AdTech: Processing 50 Billion User Profiles in Real Time with Scylla appeared first on ScyllaDB.

More Efficient Range Scan Paging with Scylla 3.0

$
0
0

More Efficient Range Scan Paging with Scylla 3.0

In a previous blog post we examined how Scylla’s paging works, explained the problems with it and introduced the new stateful paging in Scylla 2.2 that solves these problems for singular partition queries by making paging stateful.

In this second blog post we are going to look into how stateful paging was extended to support range-scans as well. We were able to increase the throughput of range scans by 30% and how we also significantly reduced the amount of data read from the disk by 39% and the amount of disk operations by 73%.

A range scan, or a full table scan, is a query which does not use the partition key in the WHERE clause. Such scans are less efficient than a single partition scan, but they are very useful for ad-hoc queries and analytics, where the selection criteria does not match the partition key.

How do Range Scans Work in Scylla 2.3?

Range scans work quite differently compared to singular partition queries. As opposed to singular partition queries, which read a single partition or a list of distinct partitions, range scans read all of the partitions that fall into the range specified by the client. The exact number of partitions that belong to a given range and their identity cannot be determined up-front, so the query has to read all of the data from all of the nodes that contain data for the range.

Tokens (and thus partitions) in Scylla are distributed on two levels. To quickly recap, a token is the hash value of the partition key, and is used as the basis for distributing the partitions in the cluster.

Tokens are distributed among the nodes, each node owning a configurable amount of chunks from the token ring. These chunks are called vnodes. Note that when the replication factor (RF) of a keyspace is larger than 1, a single vnode can be found on a number of nodes, this number being equal to the replication factor (RF).

On each node, tokens of a vnode are further distributed among the shards of the node. The token of a partition key in Scylla (which uses the MurmurHash3 hashing algorithm), is a signed 64 bit integer. The sharding algorithm ignores the 12 most significant bit of this integer, and maps the rest to a shard id. This results in a distribution that resembles a round robin.

Figure 1: Scylla’s distribution of tokens of a vnode across the shards of a node.

Figure 1: Scylla’s distribution of tokens of a vnode across the shards of a node.

A range scan also works on two levels. The coordinator has to read all vnodes that intersect with the read range, and each contacted replica has to read all shard chunks that intersect with the read vnode. Both of these present an excellent opportunity for parallelism that Scylla exploits. As already mentioned, the amount of data each vnode, and further down each shard chunk contains is unknown. Yet the read operates with a page limit that has to be respected on both levels. It is easy to see that it is impossible to find a fixed concurrency that works well on both sparse and dense tables, and everything in between. A low concurrency would be unbearably slow on a sparse table, as most requests would return very little data or no data at all. A high concurrency would overread on a dense table and most of the results would have to be discarded.

To overcome this, an adaptive algorithm is used on both the coordinator and the replicas. The algorithm works in an iterative fashion The first iteration starts with a concurrency of 1 and if the current iteration did not yield enough data to fill the page, the concurrency is doubled on the next iteration. This exponentially increasing concurrency works quite well for both dense and sparse tables. For dense tables, it will fill the page in a single iteration. For sparse tables, it will quickly reach high enough concurrency to fill the page in reasonable time.

Although this algorithm works reasonably well, it’s not perfect. It works best for dense tables where the page is filled in a single iteration. For tables that don’t have enough data to fill a page in a single iteration, it suffers from a cold-start on the beginning of each page while the concurrency is ramping up. The algorithm may also end up discarding data when the amount of data returned by the concurrent requests is above what was required to fill the page, which is quite common once the concurrency is above 1.

Figure 2: Flow diagram of an example of a page being filled on the coordinator. Note how the second iteration increases concurrency, reading two vnodes in parallel.

Figure 2: Flow diagram of an example of a page being filled on the coordinator. Note how the second iteration increases concurrency, reading two vnodes in parallel.

Figure 3: Flow diagram of an example of the stateless algorithm reading a vnode on the replica. Note the exponentially increasing concurrency. When the concurrency exceeds the number of shards, some shards (both in this example) will be asked for multiple chunks. When this happens the results need to be sorted and then merged as read ranges of the shards overlap.

Figure 3: Flow diagram of an example of the stateless algorithm reading a vnode on the replica. Note the exponentially increasing concurrency. When the concurrency exceeds the number of shards, some shards (both in this example) will be asked for multiple chunks. When this happens the results need to be sorted and then merged as read ranges of the shards overlap.

Similarly to singular partition queries, the coordinator adjusts the read range (trim the part that was already read) at the start of each page and saves the position of the page at the end.

To reiterate, all this is completely stateless. Nothing is stored on the replicas or the coordinator. At the end of each page, all those objects created and all that work invested into serving the read is discarded, and on the next page it has to be done again from scratch. The only state the query has is the paging-state cookie, which stores just enough information so that the coordinator can compute the remaining range to-be-read on the beginning of each page.

Making Range Scans Stateful

To make range scans stateful we used the existing infrastructure, introduced for making singular partition queries stateful. To reiterate, the solution we came up with was to save the reading pipeline (queriers) on the replicas in a special cache, called the querier cache. Queriers are saved at the end of the page and looked up on the beginning of the next page and used to continue the query where it was left off. To ensure that the resources consumed by this cache stay bounded, it implements several eviction strategies. Queriers can be evicted if they stay in the cache for too long or if there is a shortage of resources.

Making range scans stateful proved to be much more challenging than it was for singular partition queries. We had to make significant changes to the reading pipeline on the replica to facilitate making it stateful. The vast majority of these changes revolved around designing a new algorithm, for reading all data belonging to a range from all shards, which can be suspended and resumed from this saved state later. The new algorithm is essentially a multiplexer that combines the output of readers opened on affected shards into a single stream. The readers are created on-demand when the shard is attempted to be read from the first time. To ensure that the read won’t stall, the algorithm uses buffering and read-ahead.

Figure 4: The new algorithm for reading the contents of a vnode on a replica.

Figure 4: The new algorithm for reading the contents of a vnode on a replica.

This algorithm has several desirable properties with regards to suspending and resuming later. The most important of these is that it doesn’t need to discard data. Discarding data means that the reader, from which the data originates from, cannot be saved, because its read position will be ahead compared to the position where the read should continue from. While the new algorithm can also overread (due to the buffering and read-ahead) it will overread less, and since data is in raw form, it can be moved back to the originating readers, restoring them into a state as if they stopped reading right at reaching the limit. It doesn’t need complex exponentially increasing concurrency and the problems that come with it. No slow start and expensive sorting and merging for sparse tables.

When the page is filled only the shard readers are saved, buffered but unconsumed data is pushed back to them so there is no need to save the state of the reading algorithm. This ensures that the saved state, as a whole, is resilient to individual readers being evicted from the querier cache. Saving the state of the reading algorithm as well would have the advantage of not having to move already read data back to the originating shard when the page is over, at the cost of introducing a special state that, if evicted, would make all the shard readers unusable, as their read position would suddenly be ahead, due to data already read into buffers being discarded. This is highly undesirable, so instead we opted for moving buffered but unconsumed data back to the originating readers and saving only the shard readers. As a side note, saving the algorithm’s state would also tie the remaining pages of the query to be processed on the same shard, which is bad for load balancing.

Figure 5: Flow diagram of an example of the new algorithm filling a page.

Figure 5: Flow diagram of an example of the new algorithm filling a page. Readers are created on demand. There is no need to discard data as when reading shard chunk 5, the read stops exactly when the page is filled. Data that is not consumed but is already in the buffers is moved back to the originating shard reader. Read ahead and buffering is not represented on the diagram to keep it simple.

Diagnostics

As stateful range scans use the existing infrastructure, introduced for singular partition queries, for saving and restoring readers, the effectiveness of this caching can be observed via the same metrics, already introduced in the More Efficient Query Paging with Scylla 2.2 blog post.

Moving buffered but unconsumed data back to the originating shard can cause problems for partitions that contain loads of range tombstones. To help spot cases like this two new metrics are added:

  1. multishard_query_unpopped_fragments counts the number of fragments (roughly rows) that had to be moved back to the originating reader.
  2. multishard_query_unpopped_bytes counts the number of bytes that had to be moved back to the originating reader.

These counters are soft badness counters, they will normally not be zero, but outstanding spikes in their values can explain problems and thus should be looked at when queries are slower than expected.

Saving individual readers can fail. Although this will not fail the read itself, we still want to know when this happens. To track these events two additional counters are added:

  1. multishard_query_failed_reader_stops counts the number of times stopping a reader, executing a background read-ahead when the page ended, failed.
  2. multishard_query_failed_reader_saves counts the number of times saving a successfully stopped reader failed.

These counters are hard badness counters, they should be zero at all times, any other value indicates either serious problems with the node (no available memory or I/O errors) or a bug.

Performance

To measure the performance benefits of making range scans stateful, we compared the recently released 2.3.0 (which doesn’t have this optimization) with current master, the future Scylla Open Source 3.0.

We populated a cluster of 3 nodes with roughly 1TB of data then ran full scans against it. The nodes were n1-highmem-16 (16 vCPUs, 104GB memory) GCE nodes, with 2 local NVME SSD disks in RAID0. The dataset was composed of roughly 1.6M partitions, of which 1% was large (1M-20M), around 20% medium (100K-1M) and the rest small (>100K). We also fully compacted the table to filter out any differences due to differences in the effectiveness of compaction. The measurements were done with cache disabled.

We loaded the cluster with scylla-bench which implements an efficient range scan algorithm. This algorithm runs the scan by splitting the range into chunks and executing scans for these chunks concurrently. We could fully load the Scylla Open Source 2.3.0 cluster with two loaders, adding a third loader resulted in reads timing out. In comparison the Scylla Open Source 3.0 cluster could comfortably handle even five loaders, of course individual scans took more time compared to a run with two loaders.

After normalizing the results of the measurement we found that Scylla Open Source 3.0 can handle 1.3X more reads/s than Scylla Open Source 2.3.0. While this doesn’t sound very impressive, especially in light of the 2.5X improvements measured for singular partition queries, there is more to this than a single number.

In Scylla Open Source 3.0, the bottleneck during range-scans moves from the disk to the CPU. This is because Scylla Open Source 3.0 needs to read up to 39% less bytes and issue up to 73% less disk OPS per read, which allows the CPU cost of range scans to dominate the execution time.

In the case of a table that is not fully compacted, the improvements are expected to be even larger.

Figure 6: Chart for comparing normalized results for BEFORE (stateless scans) and AFTER (stateful scans).

Figure 6: Chart for comparing normalized results for BEFORE (stateless scans) and AFTER (stateful scans).

Summary

Making range scans stateful delivers on the promise of reducing the strain on the cluster while also increasing the throughput. It is also evident that range scans are a lot more complex than singular partition queries and being stateless was a smaller factor in their performance as compared to singular partition queries. Nevertheless, the improvements are significant and they should allow you to run range scans against your cluster knowing that your application will perform better.

The post More Efficient Range Scan Paging with Scylla 3.0 appeared first on ScyllaDB.

Overheard at Scylla Summit 2018

$
0
0
Dor Laor addresses Scylla Summit 2018

Scylla Summit 2018 was quite an event! Your intrepid reporter tried to keep up with the goings-on, live-tweeting the event from opening to close. If you missed my Tweetstream, you can pick it up here:

It’s impossible to pack two days and dozens of speakers into a few thousand words, so I’m going to give just the highlights and will embed the SlideShare links for a selected few talks. However, free to check out the ScyllaDB SlideShare page for all the presentations. And yes, in due time, we’ll post all the videos of the sessions for you to view!

Day One: Keynotes

Tuesday kicked off with ScyllaDB CEO Dor Laor giving a history of Scylla from its origins (both in mythology and as a database project) on through to its present-day capabilities in the newly-announced Scylla Open Source 3.0. He also announced the availability of early access to Scylla Cloud. Go to ScyllaDB.com/cloud to sign up! It’s on a first-come, first-served basis.

Scylla Summit 2018 Banner

Dor was followed on stage by Avi Kivity, CTO of ScyllaDB. Avi gave an overview of Scylla’s newest capabilities, from “mc” format SSTables (to bring Scylla into parity with Cassandra 3.x), to in-memory and tiered storage options.

If you know anything about Avi, you know how excited he gets when talking about low-level systemic improvements and capabilities. So he spent much of his talk on schedulers to manage write rates to balance synchronous and async updates, on how to isolate workloads, and on system resource accounting, security, and other requirements for true multi-tenancy. Full-table scans, which are a prerequisite for any sort of analytics. CQL “ALLOW FILTERING” and driver improvements. Each of these features were featured at Scylla Summit with their own in-depth talks — Avi just went through the highlights.

Customer Keynotes: Comcast & GE Digital

Tuesday also featured customer keynotes. We were honored to have some of the biggest names in technology showcase how they’re using Scylla.


First came Comcast’s Vijay Velusamy, who described how the Xfinity X1 platform now uses Scylla to support features like “last watched,” “resume watching,” and parental controls. Those preferences, channels, shows and timestamps are managed for thirteen million accounts on Scylla. Compared to their old system, they now connect Scylla directly to their REST API data services. This allows Comcast to simplify their infrastructure by getting rid of their cache and pre-cache servers, and improved performance by 10x.

GE Digital’s Venkatesh Sivasubramanian & Arvind Singh came to the stage later in the morning to talk about embedding Scylla in their Predix platform, the world’s largest Industrial Internet-of-Things (IIoT) platform. From power to aviation to 3D printing industrial components, there are entirely different classes of data that GE Digital manages.


OLTP or OLAP — Why not both?

Glauber Costa, VP of Field Engineering at ScyllaDB also had a keynote discussing Scylla’s new support of analytics and transaction processing in the same database. The challenge has always been that OLTP relies on a rapid stream of small transactions with a mix of reads and writes, and where latency is paramount, whereas OLAP is oriented towards broad data reads where throughput is paramount. Mixing those two types of loads in the past has traditionally caused one operation or the other to suffer. Thus, in the past, organizations have simply maintained two different clusters. One for transactions, and one for analytics. However, this is extremely inefficient and costly.

OLTP or OLAP — Why not both?

How can you engineer a database so that these different loads can work well together? On the same cluster? Avoiding doubling your servers and the necessity to keep two different clusters in synch? And make it work so well your database in fact becomes “boring?”

Scylla Summit 2018: OLAP or OLTP? Why Not Both? from ScyllaDB

Scylla’s new per-user SLA capability builds on the existing I/O scheduler along with a new CPU scheduler to adjust priority of low-level activities in each shard. Different tasks and users can then be granted, with precision, shares of system resources based on adjustable settings.

While you can still overload a system if you have insufficient overall resources, this new feature allows you to now mix traffic loads using a single, scalable cluster to handle all your data needs.

Breakout Sessions

Tuesday afternoon and Wednesday morning were jam-packed with session-after-session by both users presenting their use cases and war stories, as well as ScyllaDB’s own engineering staff taking deep dives into Scylla’s latest features and capabilities.

Amongst the highest-rated sessions at the conference:

Again, there’s just too much to get into a deep dive of each of these sessions. I highly encourage you to look at the dozens of presentations now up on SlideShare.

The Big Finish

Wednesday afternoon brought everyone back together for the closing general sessions, which were kicked off by Ľuboš Koščo & Michal Šenkýř of AdTech leader Sizmek. Their session on Adventures in AdTech: Processing 50 Billion User Profiles in Real Time with Scylla was impressive in many ways. They are managing Scylla across seven datacenters, serving up billions of ad bids per day in the blink of an eye in 70 countries around the world.

Real Time Bidding (RTB) process at Sizmek

Sizmek were followed by ScyllaDB’s Piotr Sarna, who delivered an in-depth presentation on three weighty and interrelated topics: Materialized Views, Secondary Indexes, and Filtering. Yes indeed, they are finally here!

Piotr Sarna at Scylla Summit 2018

Well, in fact, Materialized Views were experimental in 2.0, and Secondary Indexes were experimental in 2.1. We learned a lot and evolved their implementation working with customers using these features. With Scylla Open Source 3.0, they are both production-ready, along with the new Filtering feature.

There is a lot to digest in his talk, from handling reads-before-writes in automatic view updates for materialized views, and applying backpressure to prevent overloading clusters, to hinted handoffs for asynchronous consistency. Why we decided on global secondary indexes and how we implemented paging. Piotr also gave guidance on when to use a secondary index versus a materialized view. On top of all of that, how to apply filtering to narrow-down on the all the data you need and yet only get the data you want. When we publish it, this will definitely be one of those videos you want to digest in full.
Grab's Aravind Srinivasan at Scylla Summit 2018

Grab’s Aravind Srinivasan talked about Grab and Scylla: Driving Southeast Asia Forward. Grab, beyond being the largest ride-sharing company in their geography, has expanded to provide a broader ecosystem for online shopping, payments, and delivery. Their fraud detection system is not just important to their business internally; it is vital for the trust of their community and the financial viability of their vendors.

Technologically, Grab’s use case highlighted how vital the combination of Apache Kafka and Scylla was for his internal developers. Such a powerful tech combo was a common theme to many of the talks over the two days. Indeed, we were privileged to have Confluent’s own Hojjat Jafarpour speak about KSQL at the event.

Scylla Feature Talks were the final tech presentations of the event. It comprised a series of four highly-rated short talks by ScyllaDB engineers, spanning the gamut, from SSTable 3.0 to Scylla-Specific Drivers, to Scylla Monitor 2.0 and Streaming and Repairs.

We ended with an Ask Me Anything, featuring Dor, Avi and Glauber on stage. It was no surprise to us that many of the questions that peppered our team came from Kiwi’s Martin Strycek and Alexys Jakob! If there were any questions we didn’t get to answer for you, feel free to drop in on our Slack channel, mailing list, or Github and start a conversation.

We want to thank everyone who came to our Summit, from the open source community to the enterprise users, from the Bay Area to all parts from around the globe. We also have to give our special thanks to our many speakers who brought to us their incredible stories, remarkable achievements, and incredible solutions.

Scylla Summit 2018 Banner

The post Overheard at Scylla Summit 2018 appeared first on ScyllaDB.

Hooking up Spark and Scylla: Part 4

$
0
0
Hooking up Spark and Scylla: Part 3

Hello again! Following up on our previous post on saving data to Scylla, this time, we’ll discuss using Spark Structured Streaming with Scylla and see how streaming workloads can be written in to ScyllaDB.

Our code samples repository for this post contains an example project along with a docker-compose.yaml file with the necessary infrastructure for running the it. We’re going to use the infrastructure to run the code samples throughout the post and run the project itself, so start it up as follows:

After that is done, launch the Spark shell as in the previous posts:

With that done, let’s get started!

1. Spark Structured Streaming

So far, we’ve discussed datasets in which the entirety of the data was immediately available for processing and that the size of the dataset was known and finite. However, there are many computations that we’d like to perform on datasets of unknown or infinite size. Consider, for example, a Kafka topic to which stock quotes are continuously written:

Kafka Topic: Streaming Prices

We might want to keep track of the hourly range of change in the symbol’s price, like so:

The essence of this computation is to continuously compute the minimum and maximum price values for the symbol in every hour, and when the hour ends – output the resulting range. To do this, we must be able to perform the computation incrementally as the data itself would arrive incrementally.

Streams, infinite streams in particular, are an excellent abstraction for performing these computations. Spark’s Structured Streaming module can represent streams as the same dataframes we’ve worked with. Many transformations done on static dataframes can be equally performed on streaming dataframes. Aggregations like the one we described work somewhat differently, and require a notion of windowing. See the Spark documentation for more information on this subject.

The example project we’ve prepared for this post uses Spark Structured Streaming, ScyllaDB and Kafka to create a microservice for summarizing daily statistics on stock data. We’ll use this project to see how streams can be used in Spark, how ScyllaDB can be used with Spark’s streams and how to use another interesting Scylla feature – materialized views. More on that later on!

The purpose of the service is to continuously gather quotes for configured stocks and provide an HTTP interface for computing the following 2 daily statistics:

  • The difference between the stock’s previous close and the stock’s maximum price in the day;
  • The difference between the stock’s previous close and the stock’s minimum price in the day.

Here’s an example of the output we eventually expect to see from the service:

To get things going, run the two scripts included in the project:

These will create the Scylla schema components and start the Spark job. We’ll discuss the Scylla schema shortly; first, let’s see what components do we have for the Spark job.

NOTE: The service polls live stock data from a US-based exchange. This means that if you’re outside trading hours (9:30am – 4pm EST), you won’t see data in ScyllaDB changing too much.

There are 3 components to our service:

  • An Akka Streams-based graph that continuously polls IEX for stock data quotes, and writes those quotes to a Kafka topic. Akka Streams is a toolkit for performing local streaming computations (compared to Spark which performs distributed streaming computations). We’ll discuss it shortly and won’t delve too much into its details. If you’re interested, check out the docs – Akka Streams is an extremely expressive library and can be very useful on the JVM.
  • A Spark Streaming based component that creates a DataFrame from the stock quotes topic, extracts relevant fields from the entries and writes them to ScyllaDB.
  • An HTTP interface that runs a regular Spark query against ScyllaDB to extract statistics.

For starters, let’s see the structure of our input data. Here’s an abridged JSON response from IEX’s batch quote API:

Our polling component will transform the entries in the response to individual messages sent to a Kafka topic. Each message will have a key equal to the symbol, a timestamp equal to the latestUpdate value and a value equal to the value of the quote JSON.

Next, our Spark Streaming component will consume the Kafka topic using a streaming query. This is where things get more interesting, so let’s fiddle with some streaming queries in the Spark shell. Here’s a query that will consume the quotes Kafka topic and print the consumed messages as a textual table:

If the quotes application is running properly, this query should continuously print the data it has been writing to the Kafka topic as a textual table:

Every row passing through the stream is a message from Kafka; the row’s schema contains all the data and metadata for the Kafka messages (keys, values, offsets, timestamps, etc.). The textual tables will keep appearing until you stop the query. It can get a bit spammy, So let’s stop it:

The type of query is StreamingQuery – a handle to a streaming query running in the background. Since these queries are meant to be long-running, it is important to be able to manage their lifecycle. You could, for example, hook up the StreamingQuery handle to an HTTP API and use the query.status method to retrieve a short description of the streaming query’s status:

In any case, the schema for the streaming query is not suitable for processing – the messages are in a binary format. To adapt the schema, we use the DataFrame API:

This should print out a table similar to this:

That looks better – the key for each Kafka message is the symbol and the body is the quote data from IEX. Let’s stop the query and figure out how to parse the JSON.

This would be a good time to discuss the schema for our Scylla table. Here’s the CREATE TABLE definition:

It’s pretty straightforward – we keep everything we need to calculate the difference from the previous close for a given symbol at a given timestamp. The partitioning key is the symbol, and the clustering key is the timestamp. This primary key is not yet suitable for aggregating and extracting the minimum and maximum differences of all symbols for a given day, but we’ll get there in the next section.

To parse the JSON from Kafka, we can use the from_json function defined in org.apache.spark.sql.functions. This function will parse a String column to a composite data type given a Spark SQL schema. Here’s our schema:

The schema must be defined up front in order to properly analyze and validate the entire streaming query. Otherwise, when we subsequently reference fields from the JSON, Spark won’t know if these are valid references or not. Next, we modify the streaming query to use that schema and parse the JSON:

Now that it’s parsed, we can extract the fields we’re interested in to create a row with all the data we need at the top level. We’ll also cast the timestamp to a DataType and back in order to truncate it to the start of the day:

This should print out a table similar to this, which is exactly what we want to write to Scylla:

2. Writing to Scylla using a custom Sink

Writing to Scylla from a Spark Structured Streaming query is currently not supported out of the box with the Datastax connector (tracked by this ticket). Luckily, implementing a simplistic solution is fairly straightforward. In the sample project, you will find two classes that implement this functionality: ScyllaSinkProvider and ScyllaSink.

ScyllaSinkProvider is a factory class that will create instances of the sink using the parameters provided by the API. The sink itself is implemented using the non-streaming writing functionality we’ve seen in the previous article. It’s so short we could fit it entirely here:

This sink will write any incoming DataFrame to Scylla, assuming that the connector has been configured correctly. This interface is indicative of the way Spark’s streaming facilities operate. The streaming query processes the incoming data in batches; it’ll create batches by polling the source for data in configurable intervals. Whenever a DataFrame for a batch is created, tasks for processing the batch will be scheduled on the cluster.

To integrate this sink into our streaming query, we will replace the argument to format after writeStream with the full name of our provider class. Here’s the full snippet; there’s no need to run it in the Spark shell, as it is what the quotes service is running:

We’re also specifying an output mode, which is required by Spark (even though our sink will ignore it), parameters for the sink and the checkpoint location. Checkpoints are Spark’s mechanism for storing the streaming query’s state and allowing it to resume later. A detailed discussion is beyond the scope of this article; Yuval Itzchakov has an excellent post with more details on checkpointing if you’re interested.

Once that streaming query is running, Spark will write each DataFrame (which corresponds to a batch produced by reading from Kafka) to Scylla using our sink. We’re done with this component; let’s see how we’re going to serve our statistics over HTTP by querying Scylla.

3. Serving the statistics from Scylla

As it stands, our Scylla table stores the data queried from IEX with a partition key of symbol and a clustering key of timestamp. This is good for handling queries that deal with a single symbol; Scylla would only need to visit a single partition when processing them. However, the statistics we’d like to compute are the min/max change in price for all symbols in a given day. Therefore, to efficiently handle those queries, the primary key needs to be adjusted.

What options do we have? The easiest one is to just store the data differently. We could modify our schema to use a primary key of ((day), symbol, timestamp). This way, the statistics could be computed by visiting only one partition. However, when we would like to answer queries that focus on a single symbol, we’ll end up with the same problem.

To solve this problem, we’ll use an interesting feature offered by Scylla: materialized views. If you’re familiar with materialized views from relational databases, the Scylla implementation shares the name but is much more restrictive to maintain efficiency. See these articles for more details.

We will create a materialized view that will repartition the original data using the optimal primary key for our queries; here’s the CQL statement included in the create-tables.sh script:

The materialized view will be maintained by Scylla and will update automatically whenever we update the quotes table. We can now query it as an ordinary table. We will perform the aggregations in Spark using a plain DataFrame query:

This query, included in the HTTP routes component, aggregates the data for September 20th by symbol and computes the minimum and maximum prices for the symbols. These are then used to compute the minimum and maximum change in price compared to the previous close.

Whenever an HTTP request is sent to the service, this query is run with different date parameters and the results are sent over the HTTP response.

4. Summary

This post contained a (very) short introduction to streaming computations in general, streaming computations with Spark Structured Streaming and writing to Scylla from Spark Structured Streaming. Now, streaming is a vast subject with many aspects and nuances – state and checkpointing, windowing and high watermarks, and so forth. To learn more about the subject, I recommend two resources:

We’ve also covered the use of ScyllaDB’s materialized views – a very useful feature for situations where we need to answer a query that our schema isn’t built to handle.

Thanks for reading, and stay tuned for our next article, in which we will discuss the Scylla Migrator project.

The post Hooking up Spark and Scylla: Part 4 appeared first on ScyllaDB.

Honoring Our Users at the Scylla Summit

$
0
0

There’s nothing we enjoy more than seeing the creative and impressive things our users are doing with Scylla. With that in mind, we presented our Scylla User Awards at last week’s Scylla Summit, where we brought the winners up on stage for a big round of applause and bestowed them with commemorative trophies.

I’m glad to share the winners here, along with a few notes on their use of Scylla.

  • Most Interesting Technical Use Case: Nauto
    Nauto makes our roads safer. The company’s devices are deployed to fleet vehicles to monitor driver performance and help reduce risky behaviors. Nauto uses Scylla to store a variety of data, including 128 dimensional feature space for facial recognition, geolocation, and routes. Nauto’s algorithms interpret this data to make real-time decisions and to intervene before aggressive driving becomes a problem.
  • Most Interesting Industry Use Case: Grab
    Grab is one of the most frequently used mobile platforms in Southeast Asia, enabling their customers to commute, eat, arrange shopping deliveries, and pay with one e-wallet. Grab relies on Scylla as an aggregation metadata store, handling peak loads of 40K operations per second.
  • Best Cache Destroyer: Comcast
    Comcast’s Xfinity X1 is a first-of-its-kind multi-screen, cloud-based entertainment platform that addresses the current and future challenges of the pay TV industry. With its use of Scylla, Comcast replaced both Apache Cassandra and Varnish Cache.
  • Best Time-Series Use Case: GE Digital
    GE Digital migrated to Scylla to help drive the world’s largest IOT platform. Their requirements were to absorb tens of billions of records per day, support millions of analytics transactions and maintain sub-second response times end-to-end.
  • Scylla Humanitarian Award: Child Rescue Coalition
    Child Rescue Coalition (CRC) uses Scylla to help protect children from abuse and to bring offenders to justice. As part of this mission, CRC leverages Scylla to aggregate multiple sources of data, which result in tens of billions of records. Using this data, CRC builds tools that enable law enforcement to more efficiently identify perpetrators and to rescue children from exploitation and abuse. CRC provides this critical technology to law enforcement organizations and investigators around the world at no charge.
  • Most Datacenters: Sizmek
    Sizmek is one of the world’s largest independent advertising platforms, processing 240 billion requests per day, each one in less than 70 milliseconds. Sizmek runs Scylla in 7 datacenters, achieving high throughput with very low and consistent latency for their global customers.
  • Fastest Time to Production: Meshify
    Meshify’s IoT platform uses battery-powered wireless sensors to monitor industrial environmental environments. Using that data, Meshify is able to predict accidents, preventing them before they can happen. Meshify took advantage of Scylla’s pre-tuned AMIs to spin up a three-node cluster in 30 minutes. In disaster recovery scenarios, Scylla takes a mere 30 minutes to restore a new node.
  • Broadest Use of Scylla: Samsung
    With 57 offices spread across 31 countries, Samsung SDS plays a pivotal role across the Samsung Group of companies by improving innovation and IT competitiveness. Samsung adopted Scylla for a range of use cases, including manufacturing, IoT platform, communication and healthcare systems.
  • Most Valuable Contributions to Scylla Open Source: Alexys Jacob-Monier, Numberly
    Numberly’s multi-platform, multi-device, multi-format solutions include real-time bidding, targeted display advertising, CRM program and an advanced data management platform. Numberly uses Scylla to support real-time data for low-latency, location-based services. Alexys Jacob-Monier is well known and appreciated by our engineering and solutions teams for his contributions to Scylla.
  • Most Valuable Contribution to the Seastar Engine: Red Hat
    Red Hat Ceph Storage is an open, massively scalable storage solution for modern workloads like cloud infrastructure, analytics, media repositories, and backup and restore systems. To achieve better performance and hardware utilization, Red Hat ported Ceph to the Seastar Framework, the foundation of the Scylla database. Along the way, the team contributed numerous valuable enhancements to the open source framework.
  • Best Scylla Evangelist: Tobias Macey, Massachusetts Institute of Technology
    Tobias Macey manages and leads the Technical Operations team at MIT Open Learning, where he designs and builds cloud infrastructure to power online access to education for the global MIT community. Demonstrating his commitment to evangelizing Scylla, Tobias’s podcast on Scylla has been downloaded by more than 1,600 listeners.
  • Best Issue Reporter: Jonathan Ness, Veramine
    The Veramine platform helps keep enterprises secure through reactive intrusion response and proactive threat detection. Veramine leverages Scylla to centralize data from sensors that collect and forward all security-relevant information from Windows-based hosts across an enterprise. With this award, we recognized the great work Jonathan Ness has done in helping improve our product.

Please join us in congratulating our 2018 Scylla User Award winners! If you’ve got an innovative use of Scylla you’d like to share, please let us know. Perhaps your use case will be a 2019 Scylla User Award winner!

The post Honoring Our Users at the Scylla Summit appeared first on ScyllaDB.

See you at AWS re:Invent 2018!

$
0
0

See you at AWS re:Invent 2018!

Are you planning to attend AWS re:Invent 2018? We’d love to see you! Stop by booth #1910 in the Expo Hall at the Venetian to talk with our solution engineers, learn about Scylla, play our fun iPad game and pick up some cool Sea Monster swag.

Our solutions engineers will be on hand for live demos. See for yourself how Scylla uses as little as three i3.metal instances to do millions of transactions per second at single-digit millisecond p99 latencies. We will also demo Scylla Manager, a smart way to control and manage a Scylla cluster and maintain a high performing Scylla database. Ask us about Scylla Cloud, where all of the installation and maintenance of the Scylla database is done by our in-house experts.

Shelf of sea monsters

Still deciding which sessions to attend? We’re here to help! Here are a few sessions we recommend to help you get the most out of and secure your AWS and database deployments:

The post See you at AWS re:Invent 2018! appeared first on ScyllaDB.


Scylla Enterprise 2018.1.7 Release Announcement

$
0
0

Scylla Enterprise Release

The ScyllaDB team is pleased to announce the release of Scylla Enterprise 2018.1.7, a production-ready Scylla Enterprise minor release. Scylla Enterprise 2018.1.7 is a feature and bug fix release for the 2018.1 branch, the latest stable branch of Scylla Enterprise. More about Scylla Enterprise here.

Scylla Enterprise 2018.1.7 introduces in-memory tables. The new feature, exclusive to the Scylla Enterprise release, allows a Scylla Enterprise developer to define a table as in-memory. In-memory tables use both RAM and persistent storage to store SSTables, thus providing lower, more consistent read latency compared to on-disk storage.

Developers should use in-memory tables only for mostly-read workloads, where read latency is critical, and the size of the data is small. Workloads which require frequent writes or updates are not a use case for an in-memory table. If in doubt, contact the Scylla support team for more information.

In-memory tables use a new, proprietary compaction strategy optimized for RAM storage. Also note, every in-memory table is mirrored to disk, providing the same level of HA and persistence as on-disk tables.

To use this feature, you need to enable In-memory storage in scylla.yaml, and then use the CREATE or ALTER CQL commands to create a new in-memory table, or update an existing table’s properties.

  • More on enabling and using in-memory tables here.
  • Presentation from Scylla Summit 2018 in-memory session here.

Scylla Enterprise customers are encouraged to upgrade to Scylla Enterprise 2018.1.7 in coordination with the Scylla support team.

Related Links

Monitoring

New metrics introduced in 2018.1.7:

  • in_memory_store_total_memory
  • in_memory_store_used_memory

In-memory metrics are available in the latest Monitoring Stack, in the per server dashboard of Scylla 2018.1

Bug fix

Additional fixed issue in this release, with open source references:

  • Gossip: non zero shards may have stale (old) values of gossiper application states for some time #3798. This can create an issue with schema change propagation, for example, TRUNCATE TABLE #3694

The post Scylla Enterprise 2018.1.7 Release Announcement appeared first on ScyllaDB.

Scylla and Elasticsearch Part One: Making the (Use) Case for Both

$
0
0

Scylla and Elasticsearch

Full text search is required in many human-facing applications, such as where users need to interact with a datastore to retrieve and insert data based on partial, wildcard information, spell correction and autocompletion. Additional benefits of full text search is the ability to retrieve multiple results sorted by their relevance.

Lucene, the common parent to Solr and Elasticsearch

The most popular textual search engine in the market is Lucene. It is used by Solr, Elasticsearch, Lucidworks and other text search tools. Lucene is a great search engine. It is extremely fast, stable, and you probably can’t get much better than this.

Lucene, developed by Doug Cutting, was first released in 1999, and became an Apache Foundation open source project in 2001. Solr was developed on top of Lucene in 2004 by CNET, which donated the code to the Apache Foundation in 2006. By 2010, the projects were nearly synonymous, with Solr becoming a subproject under Lucene. It remains a Java library, though it has been ported to a number of other languages, including C++, Python, PHP, and so on.

Meanwhile, a separate project based on Lucene, known as Compass, also surfaced in 2004. This project took on a life of its own and, in 2010, its successor was released. Designed to be distributed (and thus scalable), as well as standardizing on JSON over HTTP as its interface, this was the birth of Elasticsearch. While it remains rooted in open source, the company behind it went commercial in 2012, rebranded as Elastic in 2015, and in 2018 it went public to great fanfare. Elasticsearch, like Lucene, is implemented as a Java library, and has clients written in a broad number of languages, including .NET (C#), Python, PHP, and more.

Limits of Lucene/Solr

Lucene and its child projects lack support for geo-replication, high throughput, resiliency and availability requirements to be considered a comprehensive database solution. The master-slave architecture used by Lucene (leader-replica, in Lucene’s terms) can limit usage, and result in lost connectivity or possible data loss.

While those are general limits of Lucene, there are also differences in implementation which create a compelling argument for Elasticsearch over its cousin. Especially Elasticsearch’s support for distribution and multi-tenancy.

Some Major Differences Between Elasticsearch and Solr

  1. Node Discovery: Elasticsearch uses its own discovery implementation called Zen that, for full fault tolerance (i.e. not being affected by network splits), requires a minimum of two and ideally three dedicated master nodes. Solr uses Apache Zookeeper for discovery and leader election. This requires an external Zookeeper ensemble, which for fault tolerant and fully available SolrCloud cluster requires at least three Zookeeper instances.
  2. Shard Placement: Elasticsearch is very dynamic as far as placement of indices and shards they are built of is concerned. It can move shards around the cluster when a certain action happens – for example when a new node joins or a node is removed from the cluster. We can control where the shard should and shouldn’t be placed by using awareness tags and we can tell Elasticsearch to move shards around on demand using an API call. Solr, on the other hand, is a bit more static.
  3. Caches: When you index data Lucene produces segments. It can also merge multiple smaller, existing segments into larger ones during a process called segment merging. The caches in Solr are global, with a single cache instance of a given type for a shard for all its segments. When a single segment changes the whole cache needs to be invalidated and refreshed. That takes time and consumes hardware resources. In Elasticsearch caches are per-segment, which means that if only a single segment changed then only a small portion of the cached data needs to be invalidated and refreshed.
  4. Beyond Text Search: Solr has focused primarily on text search. It does a great job at this, and is a defacto standard for search applications. But Elasticsearch has moved in a different direction where it goes beyond text search to tackle log analytics and visualization with the Elastic stack (Logstash and Kibana). See example of using the Elastic stack in one of our previous blogs.

Apache Solr vs Elasticsearch: the full feature smackdown can be found here.

Advantages of Elastic+Scylla over Cassandra+Solr

You can further empower Elasticsearch by putting Scylla as a persistent, distributed database behind it. Elasticsearch offers an advanced API to integrate and query data from the search engine, while Scylla provides the high throughput, highly available datastore.

Elastic and Scylla are best of breed, each in its field. Both were designed from the ground up for horizontal scalability, meaning you should be able to keep growing your enterprise data seamlessly, terabyte after terabyte.

Why not do them all in one or the other? It’s a fair question, but experience shows that your search workload may need different scaling than your operational database. Having both Elastic and Scylla, separately, provides you that flexibility. Combined, you have a broad range of options finding the data you need. Either employ full-text search with Elasticsearch, or, with Scylla, use materialized viewssecondary indexes, or efficient full table scans.

We’ve gone into extensive detail elsewhere as to why Scylla performs better than Cassandra. This includes everything from Scylla’s C++ code base, which avoids the limitations of the Java Virtual Machine, including Cassandra’s inability to take advantage of multi-core/multi-CPU hardware, to the latency spikes of Garbage Collection (GC), to other advantages unique to Scylla, such as autotuning upon installation and in runtime by our I/O Scheduler and Compaction Controller.

With Cassandra and its Java-based code, it is challenging to configure both the JVM and the caches correctly. Adding Solr to the mix practically guarantees you wouldn’t have an ideal configuration, because the same JVM process needs to serve both Solr and Cassandra. Both different workloads put far more stress on the GC.

While Elasticsearch is based on Java, the fact that Scylla is written in C++ means that it will not be triggering or exacerbating any JVM or GC issues.

Although Cassandra and Solr run in one process, each has its own write path. Which means that when failures happen, data may not be consistent between the SSTable store and the Solr files. At least with Elastic+Scylla running separately if a failure occurs you’re aware it happens and you can potentially isolate data errors.

Next Steps

While here we make the case for using Scylla plus Elasticsearch together, in our next blog, we’ll explore some more practical use cases, as well as examples of configuring both to work together. If in the meanwhile, you wish to do some experimentation on your own, remember that both Scylla and Elasticsearch are open source. Feel free to check out our blog from last year and follow along to make your own working demo.

Finally, if you have your own experience using both Scylla and Elasticsearch combined in your environment, we’d love to hear your feedback!

The post Scylla and Elasticsearch Part One: Making the (Use) Case for Both appeared first on ScyllaDB.

Worry-Free Ingestion: Flow Control of Writes in Scylla

$
0
0

Scylla Flow Control

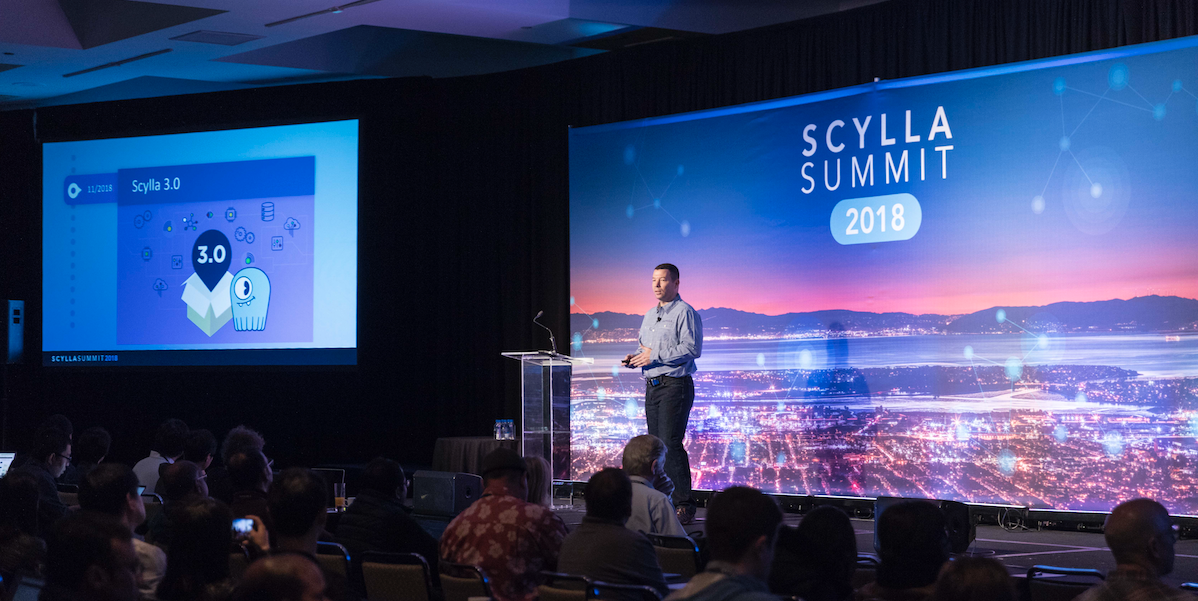
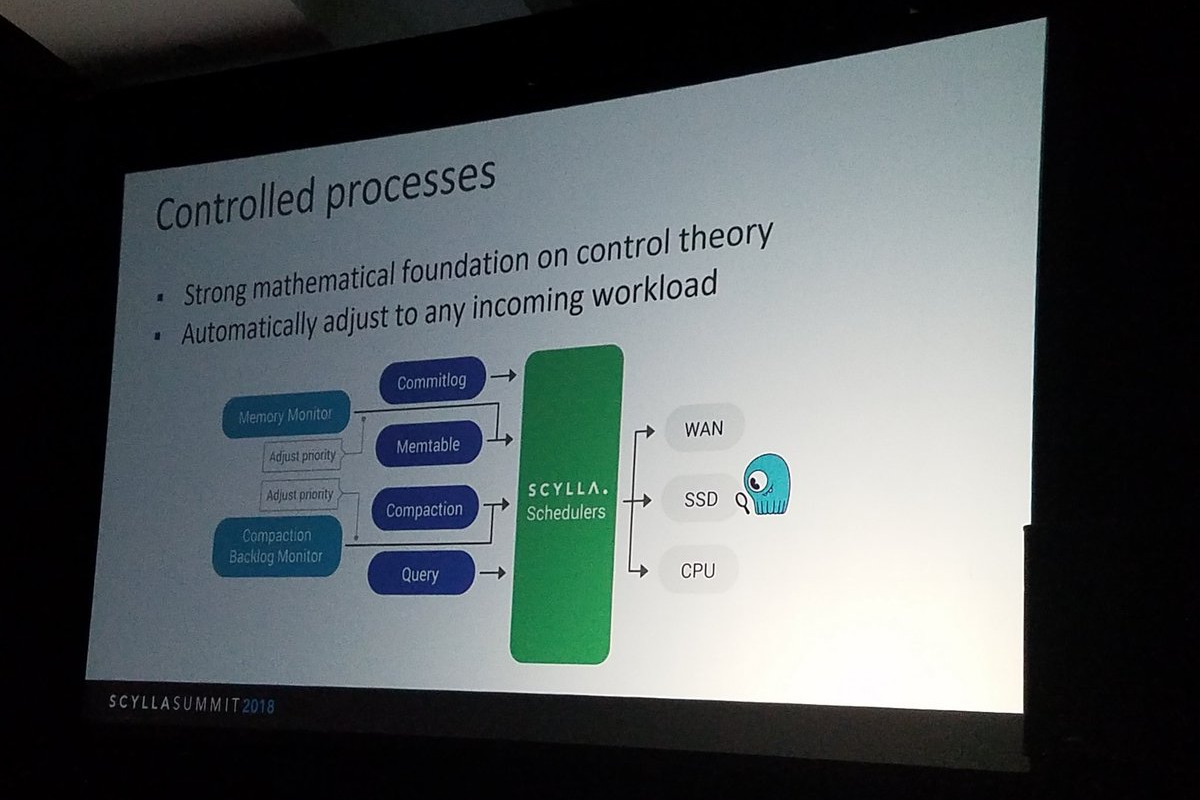
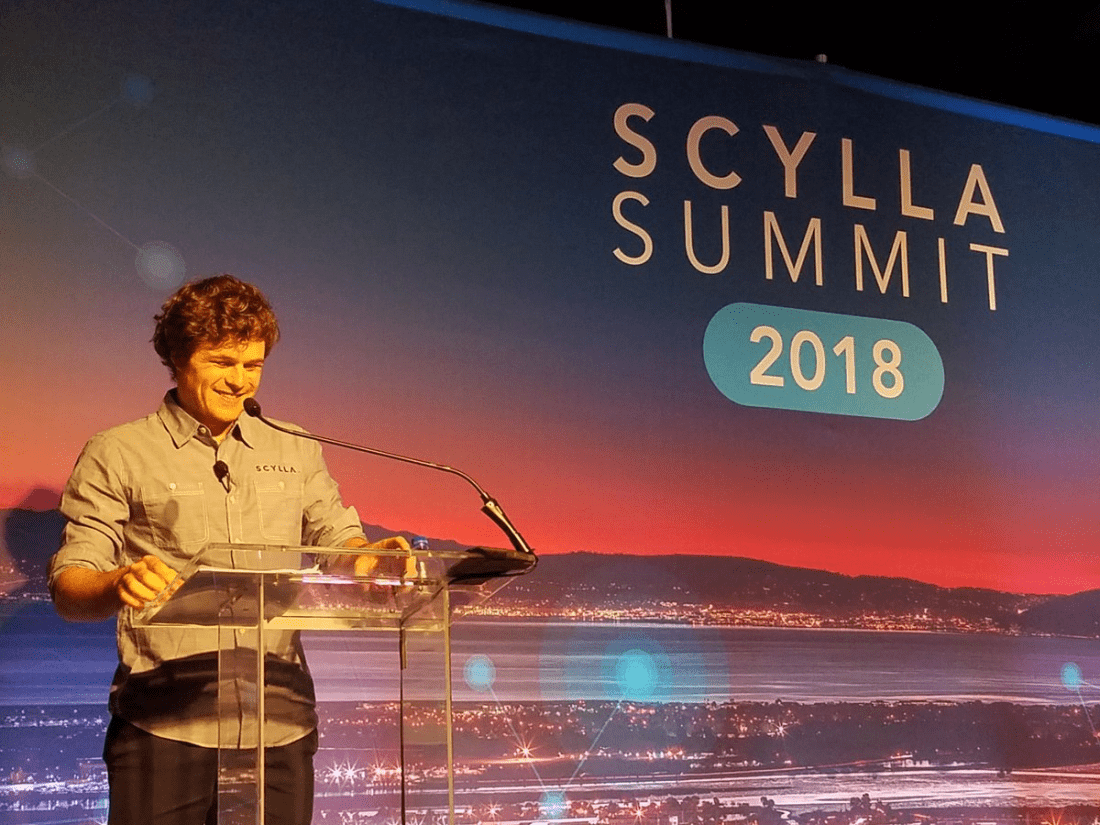
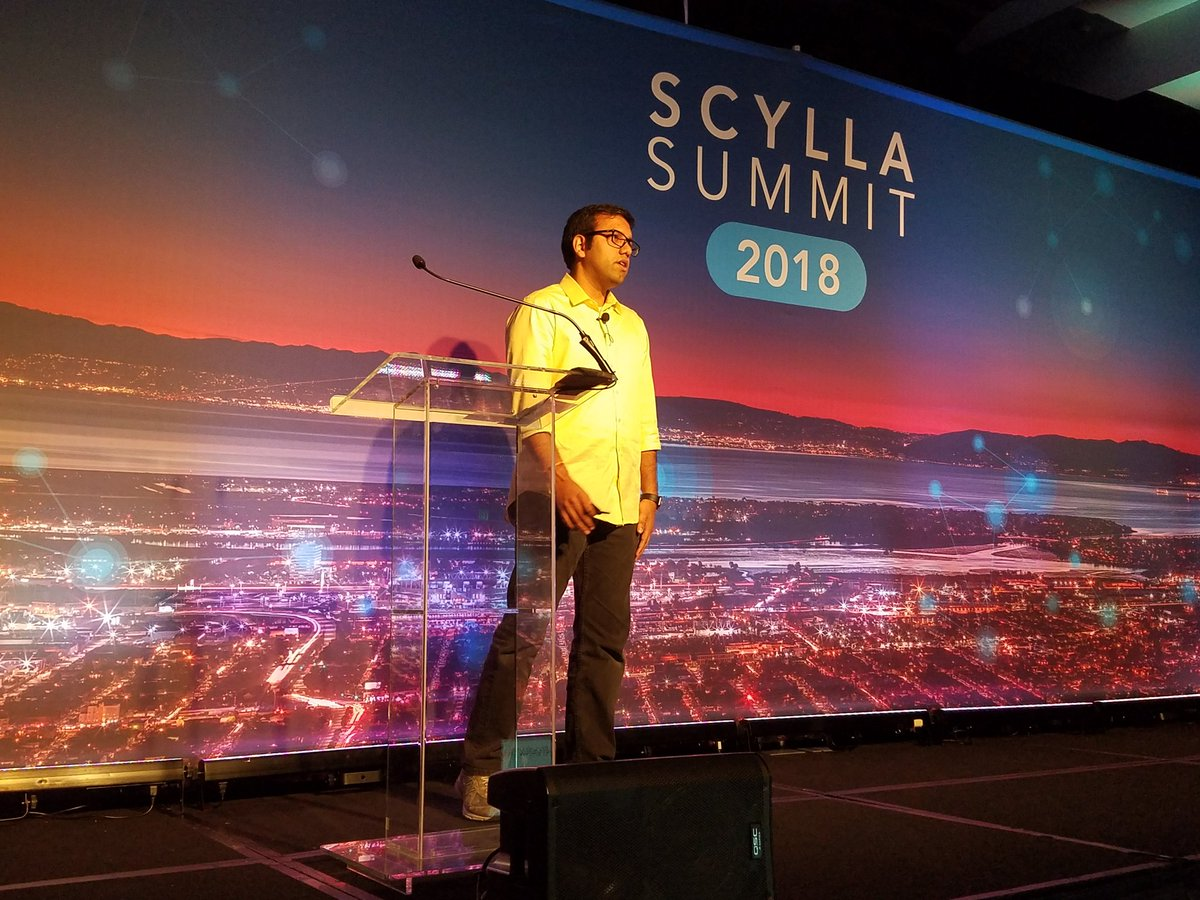
This blog post is based on a talk I gave last month at the third annual Scylla Summit in San Francisco. It explains how Scylla ensures that ingestion of data proceeds as quickly as possible, but not quicker. It looks into the existing flow-control mechanism for tables without materialized views, and into the new mechanism for tables with materialized views, which is introduced in the upcoming Scylla Open Source 3.0 release.

Introduction

In this post we look into ingestion of data into a Scylla cluster. What happens when we make a large volume of update (write) requests?

We would like the ingestion to proceed as quickly as possible but without overwhelming the servers. An over-eager client may send write requests faster than the cluster can complete earlier requests. If this is only a short burst of requests, Scylla can absorb the excess requests in a queue or numerous queues distributed throughout the cluster (we’ll look at the details of these queues below). But had we allowed the client to continue writing at this excessive rate, the backlog of uncompleted writes would continue to grow until the servers run out of memory and possibly crash. So as the backlog grows, we need to find a way for the server to tell the client to slow down its request rate. If we can’t slow down the client, we have to start failing new requests.

Cassandra’s CQL protocol does not offer any explicit flow-control mechanisms for the server to slow down a client which is sending requests faster than the server can handle them. We only have two options to work with: delaying replies to the client’s requests, and failing them. How we can use these two options depends on what drives the workload: We consider two different workload models — a batch workload with bounded concurrency, and an interactive workload with unbounded concurrency:

  1. In a batch workload, a client application wishes to drive the server at 100% utilization for a long time, to complete some predefined amount of work. There is a fixed number of client threads, each running a request loop: preparing some data, making a write request, and waiting for its response. The server can fully control the request rate by rate-limiting (delaying) its replies: If the server only sends N replies per second, the client will only send N new requests per second. We call this rate-limiting of replies, or throttling.

  2. In an interactive workload, the client sends requests driven by some external events (e.g., activity of real users). These requests can come at any rate, which is unrelated to the rate at which the server completes previous requests. For such a workload, if the request rate is at or below the cluster’s capacity, everything is fine and the request backlog will be mostly empty. But if the request rate is above the cluster’s capacity, the server has no way of slowing down these requests and the backlog grows and grows. If we don’t want to crash the server (and of course, we don’t), we have no choice but to return failure for some of these requests.

    When we do fail requests, it’s also important how we fail: We should fail fresh new, not yet handled, client requests. It’s a bad idea to fail requests to which we had already devoted significant work — if the server spends valuable CPU time on requests which will end up being failed anyway, throughput will lower. We use the term admission control for a mechanism which fails a new request when it believes the server will not have the resources needed to handle the request to completion.

For these reasons Scylla utilizes both throttling and admission control. Both are necessary. Throttling is a necessary part of handling normal batch workloads, and admission control is needed for unexpected overload situations. In this post, we will focus on the throttling part.

We sometimes use the term backpressure to describe throttling, which metaphorically takes the memory “pressure” (growing queues) which the server is experiencing, and feeds it back to the client. However, this term may be confusing, as historically it was used for other forms of flow control, not for delaying replies as a mechanism to limit the request rate. In the rest of this document I’ll try to avoid the term “backpressure” in favor of other terms like throttling and flow control.

Above we defined two workload models — interactive and and batch workloads. We can, of course, be faced by a combination of both. Moreover, even batch workloads may involve several independent batch clients, starting at different times and working with different concurrencies. The sum of several such batch workloads can be represented as one batch workload with a changing client concurrency. E.g., a workload can start with concurrency 100 for one minute, then go to concurrency 200 for another minute, etc. Our flow control algorithms need to reasonably handle this case as well, and react to a client’s changing concurrency. As an example, consider that the client doubled the number of threads. Since the total number of writes the server can handle per second remains the same, now each client thread will need to send requests at half the rate it sent earlier when there were just half the number of threads.

The problem of background writes

Let’s first look at writes to regular Scylla tables which do not have materialized views. Later we can see how materialized views further complicate matters.

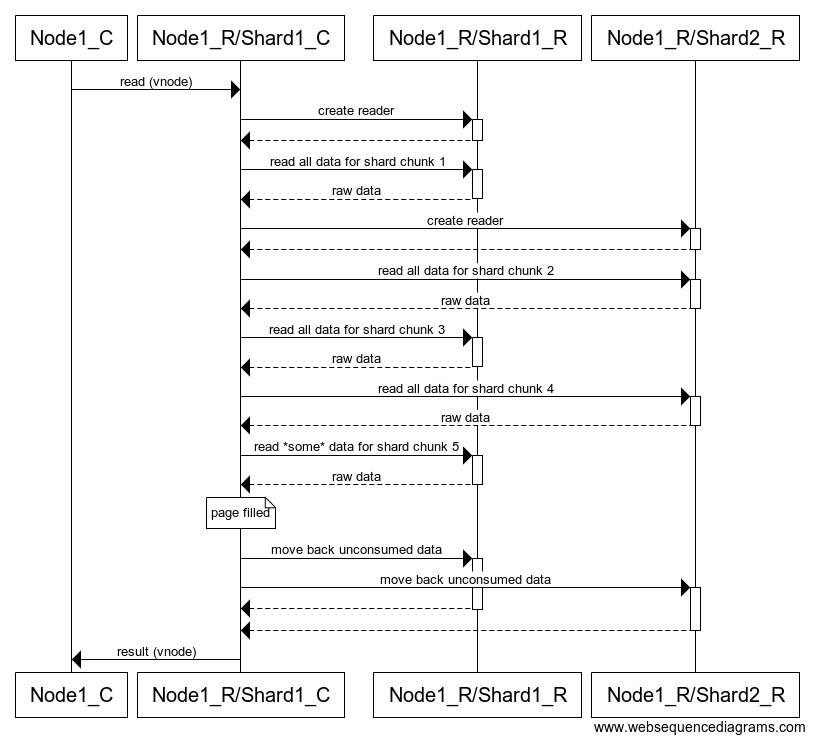
A client sends an update (a write request) to a coordinator node, which sends the update to RF replicas (RF is the replication factor — e.g., 3). The coordinator then waits for first CL (consistency level — e.g., 2) of those writes to have completed, at which point it sends a reply to the client, saying that the desired consistency-level has been achieved. The remaining ongoing writes to replicas (RF-CL — in the above examples =1 remaining write) will then continue “in the background”, i.e., after the response to the client, and without the client waiting for them to finish.

The problem with these background writes is that a batch workload, upon receiving the server’s reply, will send a new request before these background writes finish. So if new writes come in faster than we can finish background writes, the number of these background writes can grow without bound. But background writes take memory, so we cannot allow them to grow without bound. We need to apply some throttling to slow the workload down.

The slow node example

Before we explain how Scylla does this throttling, it is instructive to look at one concrete — and common — case where background writes pile up and throttling becomes necessary.

This is the case where one of the nodes happens to be, for some reason, consistently slower than the others. It doesn’t have to be much slower — even a tiny bit slower can cause problems:

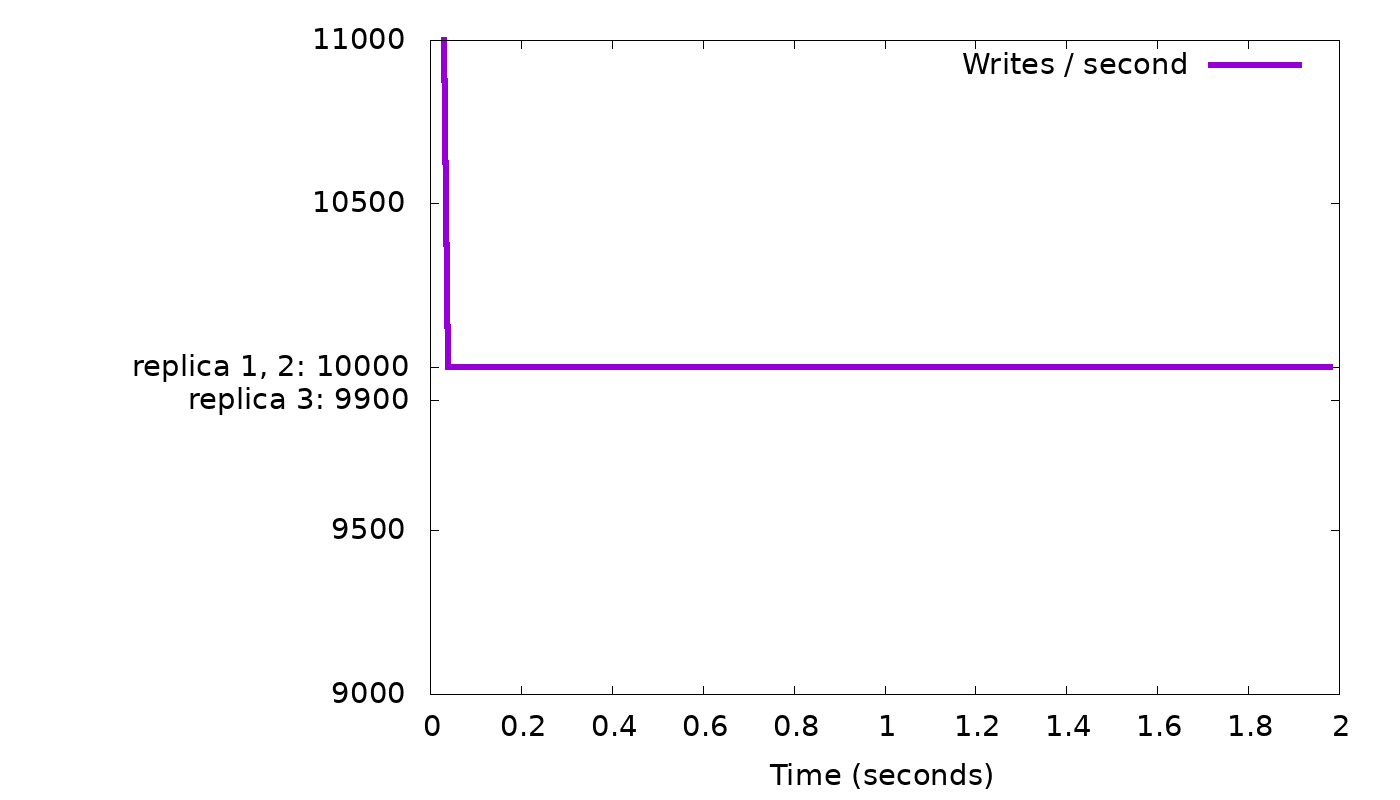
Consider, for example, three nodes and a table with RF=3, i.e., all data is replicated on all three nodes, so all writes need to go to all three. Consider than one node is just 1% slower: Two of the nodes can complete 10,000 replica writes per second, while the third can only complete 9,900 replica writes per second. If we do CL=2 writes, then every second 10,000 of these writes can complete after node 1 and 2 completed their work. But since node 3 can only finish 9,900 writes in this second, we will have added 100 new “background writes” waiting for the write to node 3 to complete. We will continue to accumulate 100 additional background writes each second and, for example, after 100 seconds we will have accumulated 10,000 background writes. And this will continue until we run out of memory, unless we slow down the client to only 9,900 writes per second (and in a moment, we’ll explain how). It is possible to demonstrate this and similar situations in real-life Scylla clusters. But to make it easier to play with different scenarios and flow-control algorithms, we wrote a simple simulator. In the simulator we can exactly control the client’s concurrency, the rate at which each replica completes write requests, and then graph the lengths of the various queues, the overall write performance, and so on, and investigate how those respond to different throttling algorithms.

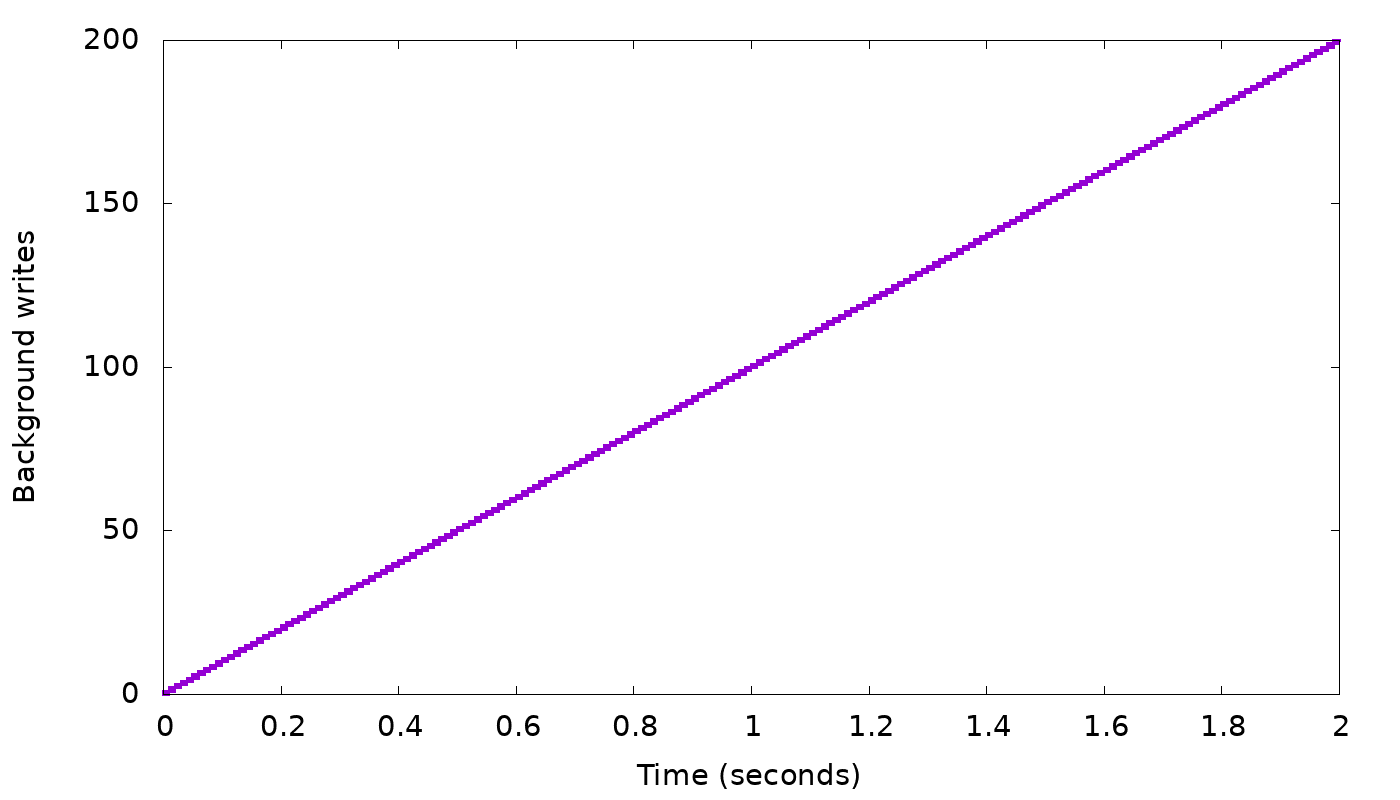
In our simple “slow node” example, we see the following results from the simulator:

Simulator Results, Figure 1

Simulator Results 2

In the top graph, we see that a client with fixed concurrency (arbitrarily chosen as 50 threads) writing with CL=2 will, after a short burst, get 10,000 replies each second, i.e., the speed of the two fastest nodes. But while staying at that speed, we see in the bottom graph that the backlog of background writes grows continuously — 100 every second, as we suspected. We need to slow down the client to curb this growth.

It’s obvious from the description above that any consistent difference in node performance, even much smaller than 1%, will eventually cause throttling to be needed to avoid filling the entire memory with backlogged writes. In real-life such small performance differences do happen in clouds, e.g., because some of the VMs have busier “neighbors” than others.

Throttling to limit background writes

Scylla applies a simple, but effective, throttling mechanism: When the total amount of memory that background writes are currently using goes over some limit — currently 10% of the shard’s memory — the coordinator starts throttling the client by no longer moving writes from foreground to background mode. This means that the coordinator will only reply when all RF replica writes have completed, with no additional work left in the background. When this throttling is on, the backlog of background writes does not continue to grow, and replies are only sent at the rate we can complete all the work, so a batch workload will slow down its requests to the same rate.

It is worth noting that when throttling is needed, the queue of background writes will typically hover around its threshold size (e.g., 10% of memory). When a flow-control algorithm always keeps a full queue, it is said to suffer from the bufferbloat problem. The typical bufferbloat side-effect is increased latency, but happily in our case this is not an issue: The client does not wait for the background writes (since the coordinator has already returned a reply), so the client will experience low latency even when the queue of background writes is full. Nevertheless, the full queue does have downsides: it wastes memory and it prevents the queue from absorbing writes to a node that temporarily goes down.

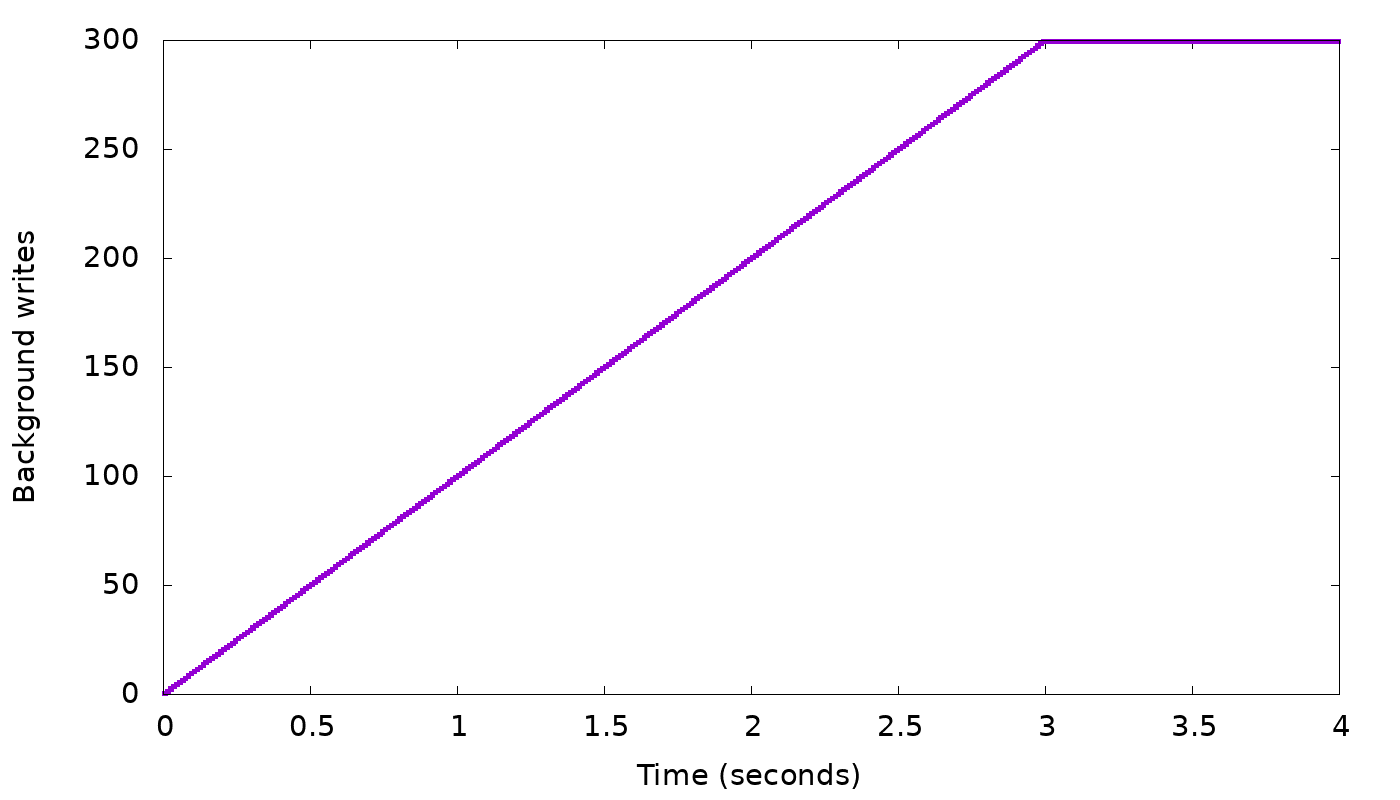
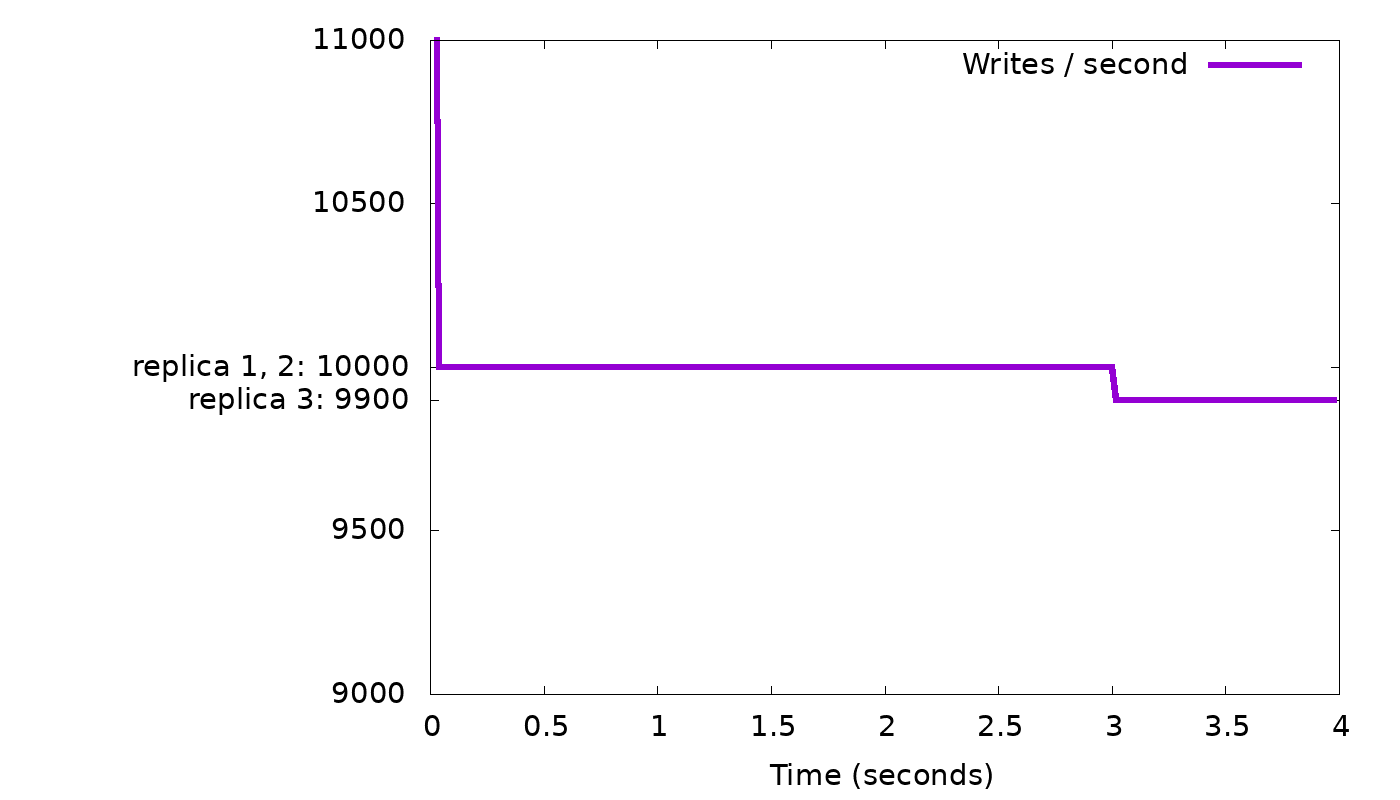
Let’s return to our “slow node” simulation from above, and see how this throttling algorithm indeed helps to curb the growth of the backlog of background writes:

Simulator Results 3

Simulator Results 4

As before, we see in the top graph that the server starts by sending 10,000 replies per second, which is the speed of the two fastest nodes (remember we asked for CL=2). At that rate, the bottom graph shows we are accruing a backlog of 100 background writes per second, until at time 3, the backlog has grown to 300 items. In this simulation we chose 300 as background write limit (representing the 10% of the shard’s memory in real Scylla). So at that point, as explained above, the client is throttled by having its writes wait for all three replica writes to complete. Those will only complete at rate of 9,900 per second (the rate of the slowest node), so the client will slow down to this rate (top graph, starting from time 3), and the background write queue will stop growing (bottom graph). If the same workload continues, the background write queue will remain full (at the threshold 300) — if it temporarily goes below the threshold, throttling is disabled and the queue will start growing back to the threshold.

The problem of background view updates

After understanding how Scylla throttles writes to ordinary tables, let’s look at how Scylla throttles writes to materialized views. Materialized views were introduced in Scylla 2.0 as an experimental feature — please refer to this blog post if you are not familiar with them. They are officially supported in Scylla Open Source Release 3.0, which also introduces the throttling mechanism we describe now, to slow down ingestion to the rate at which Scylla can safely write the base table and all its materialized views.

As before, a client sends a write requests to a coordinator, and the coordinator sends them to RF (e.g., 3) replica nodes, and waits for CL (e.g., 2) of them to complete, or for all of them to complete if the backlog of background write reached the limit. But when the table (also known as the base table) has associated materialized views, each of the base replicas now also sends updates to one or more paired view replicas — other nodes holding the relevant rows of the materialized views.

The exact details of which updates we send, where, and why is beyond the scope of this post. But what is important to know here is that the sending of the view updates always happens asynchronously — i.e., the base replica doesn’t wait for it, and therefore the coordinator does not wait for it either — only the completion of enough writes to the base replicas will determine when the coordinator finally replies to the client.

The fact that the client does not wait for the view updates to complete has been a topic for heated debate ever since the materialized view feature was first designed for Cassandra. The problem is that if a base replica waits for updates to several view replicas to complete, this hurts high availability which is a cornerstone of Cassandra’s and Scylla’s design.

Because the client does not wait for outstanding view updates to complete, their number may grow without bound and use unbounded amounts of memory on the various nodes involved — the coordinator, the RF base replicas and all the view replicas involved in the write. As in the previous section, here too we need to start slowing down the client, until the rate when the system completes background work at the same rate as new background work is generated.

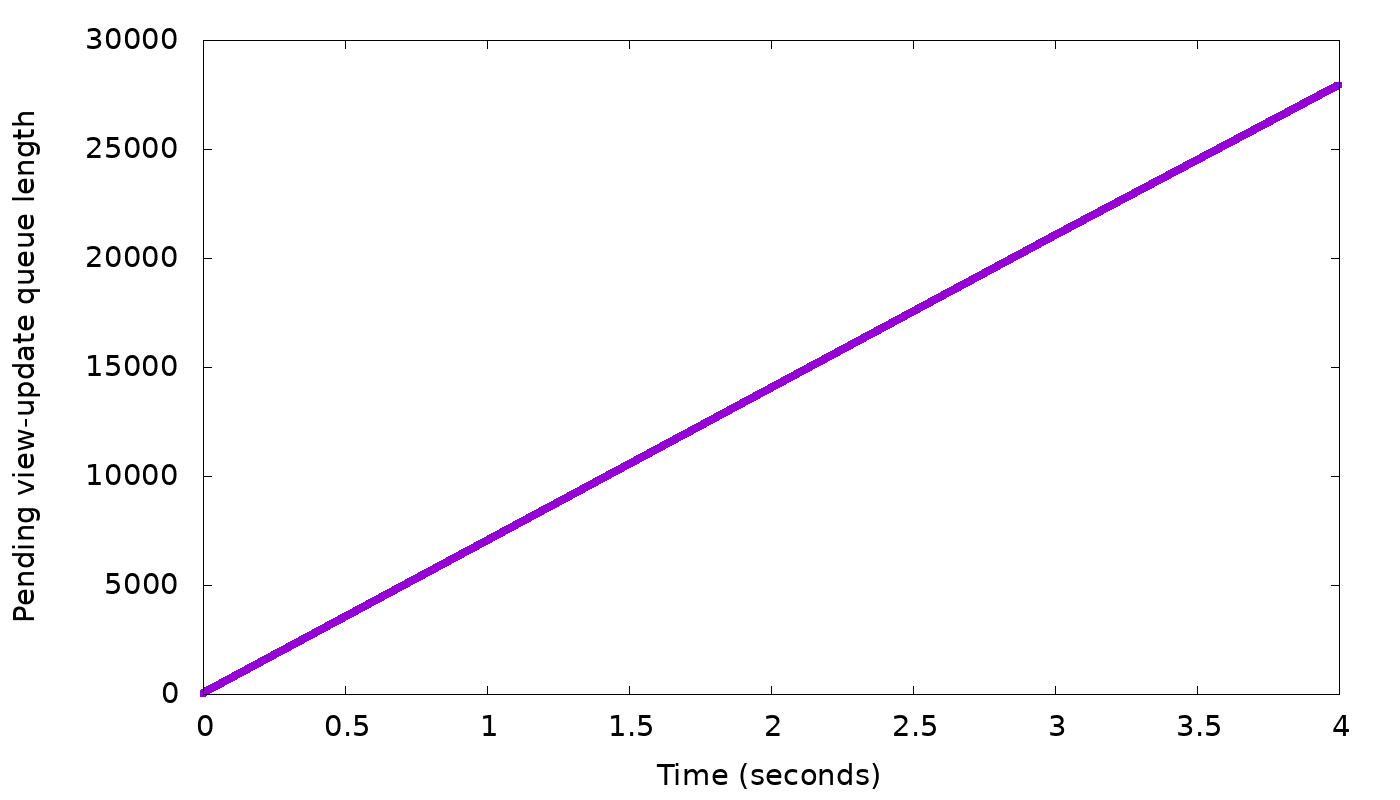
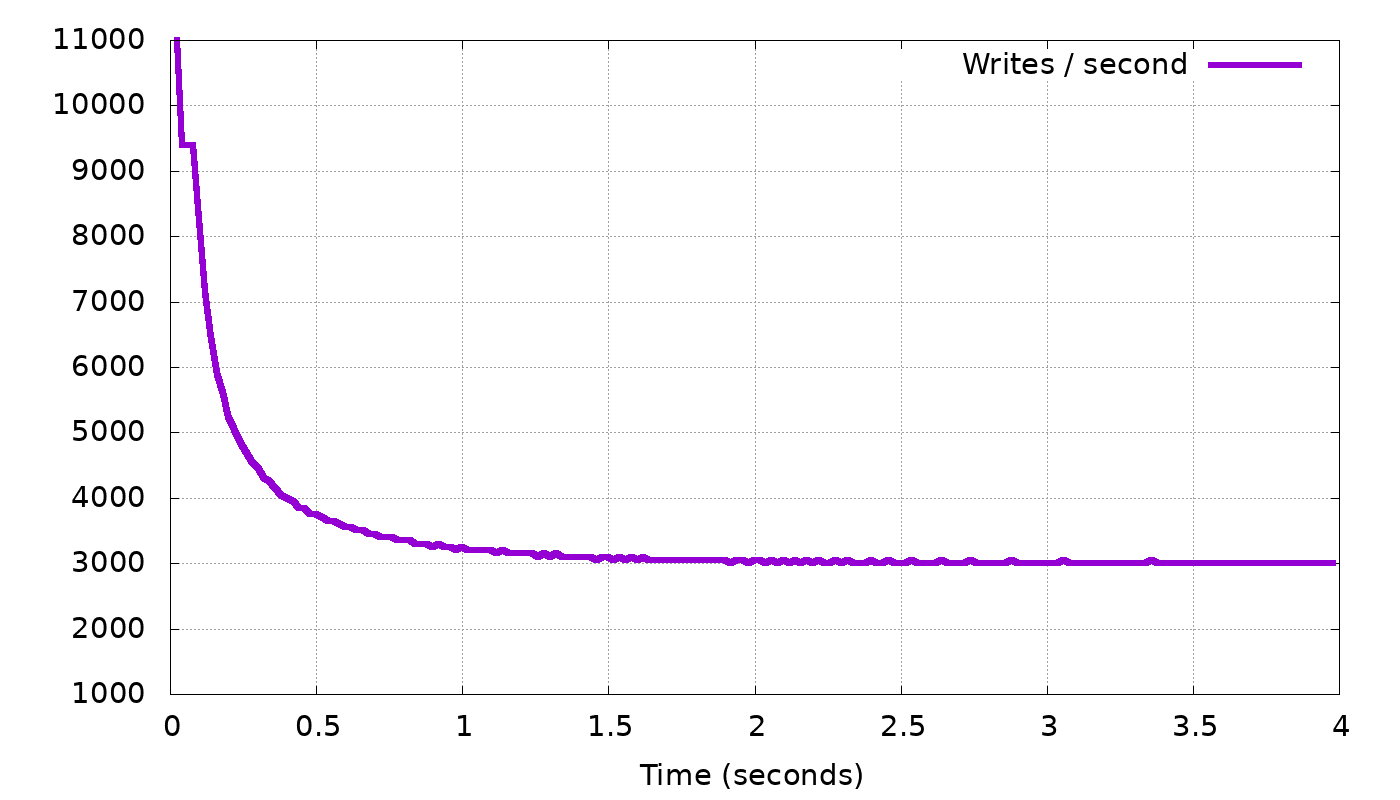
To illustrate the problem Scylla needed to solve, let’s use our simulator again to look at a concrete example, continuing the same scenario we used above. Again we have three nodes, RF=3, client with 50 threads writing with CL=2. As before two nodes can complete 10,000 base writes per second, and the third only 9,900. But now we introduce a new constraint: the view updates add considerable work to each write, to the point that the cluster can now only complete 3,000 writes per second, down from the 9,900 it could complete without materialized views. The simulator shows us (top graph below) that, unsurprisingly, without a new flow-control mechanism for view writes the client is only slowed down to 9,900 requests per second, not to 3,000. The bottom graph shows that at this request rate, the memory devoted to incomplete view writes just grows and grows, by as many as 6,900 (=9,900-3,000) updates per second:

Simulator Results 5

Simulator Results 6

So, what we need now is to find a mechanism for the coordinator to slow down the client to exactly 3,000 requests per second. But how do we slow down the client, and how does the coordinator know that 3,000 is the right request rate?

Throttling to limit background view updates

Let us now explain how Scylla 3.0 throttles the client to limit the backlog of view updates. We begin with two key insights:

  1. To slow down a batch client (with bounded concurrency), we can add an artificial delay to every response. The longer the delay is, the lower the client’s request rate will become.
  2. The chosen delay influences the size of the view-update backlog: Picking a higher delay slows down the client and slows the growth of the view update backlog, or even starts reducing it. Picking a lower delay speeds up the client and increases the growth of the backlog.

Basically, our plan is to devise a controller, which changes the delay based on the current backlog, trying to keep the length of the backlog in a desired range. The simplest imaginable controller, a linear function, works amazingly well:

(1) delay = α ⋅ backlog

Here α is any constant. Why does this deceptively-simple controller work?

Remember that if delay is too small, backlog starts increasing, and if delay is too large, the backlog starts shrinking. So there is some “just right” delay, where the backlog size neither grows nor decreases. The linear controller converges on exactly this just-right delay:

  1. If delay is lower than the just-right one, the client is too fast, the backlog increases, so according to our formula (1), we will increase delay.
  2. If delay is higher than the just-right one, the client is too slow, the backlog shrinks, so according to (1), we will decrease delay.

Let’s add to our simulator the ability to delay responses by a given delay amount, and to vary this delay according to the view update backlog in the base replicas, using formula (1). The result of this simulation looks like this:

Simulator Results 7

Simulator Results 8

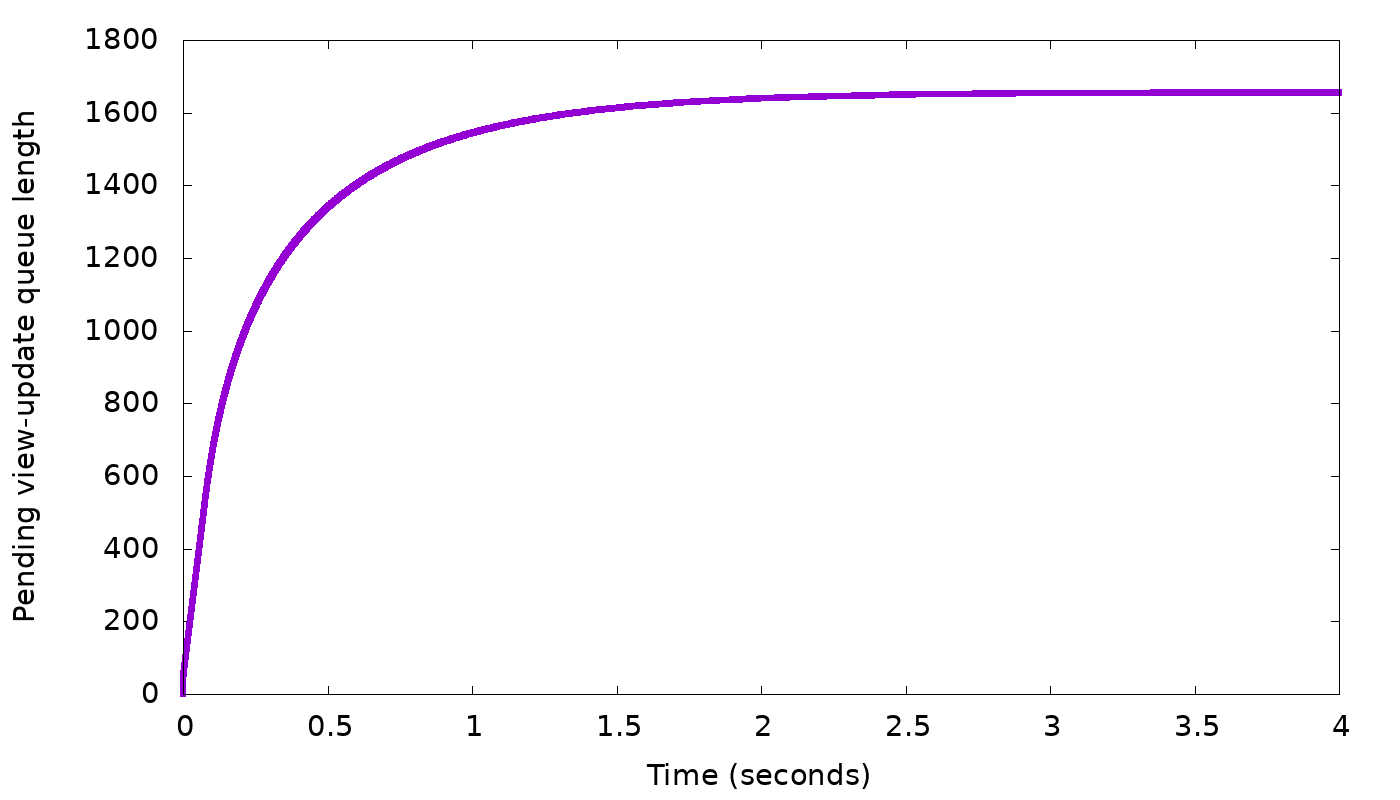
In the top graph, we see the client’s request rate gradually converging to exactly the request rate we expected: 3,000 requests per second. In the bottom graph, the backlog length settles on about 1600 updates. The backlog then stops growing any more — which was our goal.

But why did the backlog settle on 1600, and not on 100 or 1,000,000? Remember that the linear control function (1) works for any α. In the above simulation, we took α = 1.0 and the result was convergence on backlog=1600. If we change α, the delay to which we converge will still have to be the same, so (1) tells us that, for example, if we double α to 2.0, the converged backlog will halve, to 800. In this manner, if we gradually change α we can reach any desired backlog length. Here is an example, again from our simulator, where we gradually changed α with the goal of reaching a backlog length of 200:

Simulator Results 9

Simulator Results 10

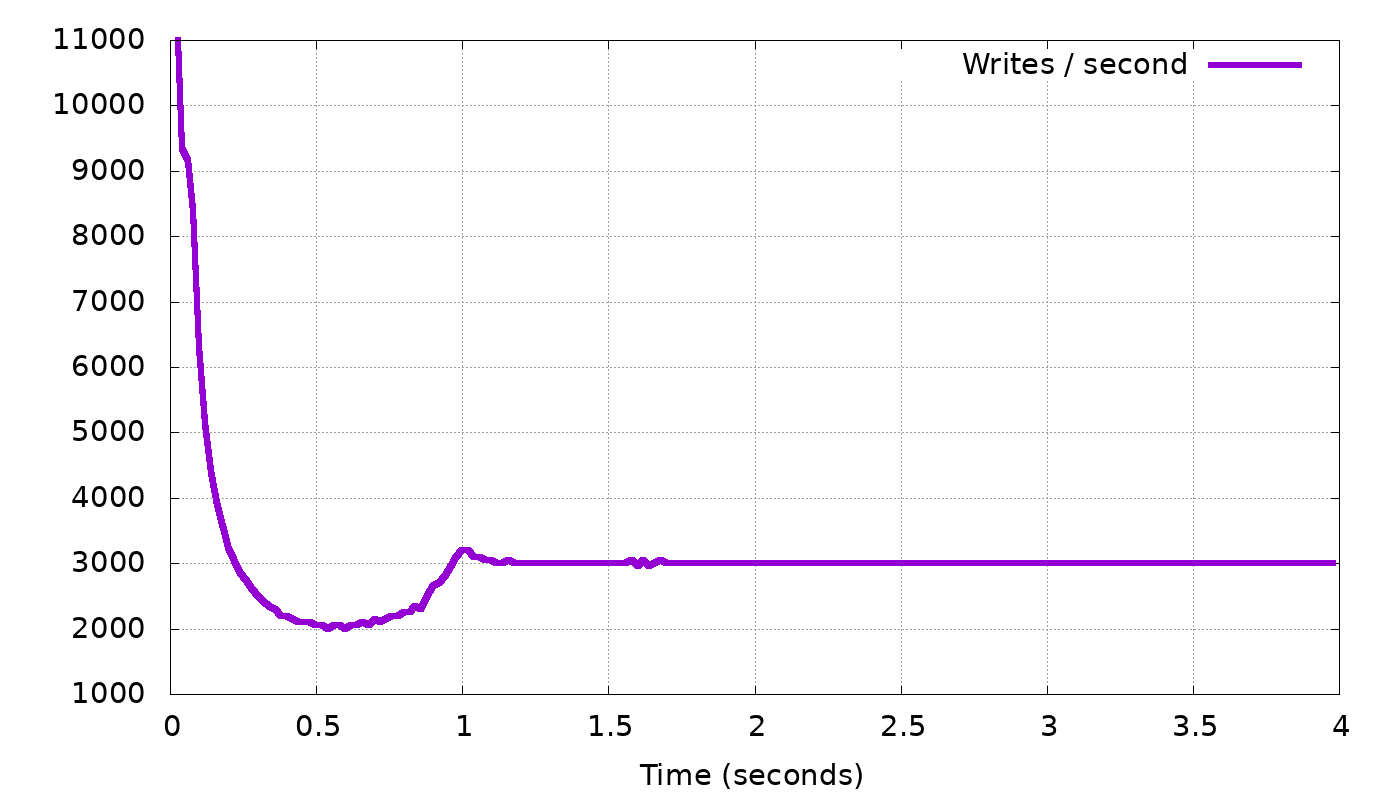
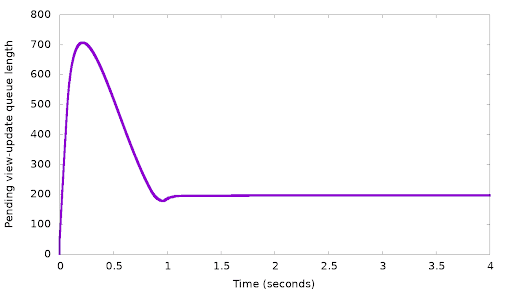
Indeed, we can see in the lower graph that after over-shooting the desired queue length 200 and reaching 700, the controller continues to increase to decrease the backlog, until the backlog settles on exactly the desired length — 200. In the top graph we see that as expected, the client is indeed slowed down to 3,000 requests per second. Interestingly in this graph, we also see a “dip”, a short period where the client was slowed down even further, to just 2,000 requests per second. The reason for this is easy to understand: The client starts too fast, and a backlog starts forming. At some point the backlog reached 700. Because we want to decrease this backlog (to 200), we must have a period where the client sends less than 3,000 requests per second, so that the backlog would shrink.

In controller-theory lingo, the controller with the changing α is said to have an integral term: the control function depends not just on the current value of the variable (the backlog) but also on the previous history of the controller.

In (1), we considered the simplest possible controller — a linear function. But the proof above that it converges on the correct solution did not rely on this linearity. The delay can be set to any other monotonically-increasing function of the backlog:

(2) delay = f(backlog / backlog0 delay0

(where backlog0 is a constant with backlog units, and delay0 is a constant with time units).

In Scylla 3.0 we chose this function to be a polynomial, selected to allow relatively-high delays to be reached without requiring very long backlogs in the steady state. But we do plan to continue improving this controller in future releases.

Conclusion

A common theme in Scylla’s design, which we covered in many previous blog posts, is the autonomous database, a.k.a. zero configuration. In this post we covered another aspect of this theme: When a user unleashes a large writing job on Scylla, we don’t want him or her to need to configure the client to use a certain speed or risk overrunning Scylla. We also don’t want the user to need to configure Scylla to limit an over-eager client. Rather, we want everything to happen automatically: The write job should just just run normally without any artificial limits, and Scylla should automatically slow it down to exactly the right pace — not too fast that we start piling up queues until we run out of memory, but also not too slow that we let available resources go to waste.

In this post, we explained how Scylla throttles (slows down) the client by delaying its responses, and how we arrive at exactly the right pace. We started with describing how throttling works for writes to ordinary tables — a feature that had been in Scylla for well over a year. We then described the more elaborate mechanisms we introduce in Scylla 3.0 for throttling writes to tables with materialized views. For demonstration purposes, we used a simulator for the different flow-control mechanisms to better illustrate how they work. However, these same algorithms have also been implemented in Scylla itself — so go ahead and ingest some data! Full steam ahead!

Flow Control Finish

The post Worry-Free Ingestion: Flow Control of Writes in Scylla appeared first on ScyllaDB.

Scylla Manager 1.3 Release Announcement

$
0
0

Scylla Manager Release

The Scylla Enterprise team is pleased to announce the release of Scylla Manager 1.3, a production-ready release of Scylla Manager for Scylla Enterprise customers.

Scylla Manager 1.3 adds a new Health Check, which works as follows.. Scylla nodes are already reporting on their status through “nodetool status” and via Scylla Monitoring Stack dashboards; but in some cases, it is not enough. A node might report an Up-Normal (UN) status, while in fact, it is slow or not responding to CQL requests. This might be a result of an internal problem in the node, or an external issue (for example, a blocked CQL port somewhere between the application and the Scylla node).

Scylla Manager’s new Health Check functionality helps identify such issues as soon as possible, playing a similar role to an application querying the CQL interface from outside the Scylla cluster.

Scylla Manager 1.3 automatically adds a new task to each a new managed cluster. This task is a health check which sends a CQL OPTION command to each Scylla node and measures the response time. If there is a response faster than 250ms the node is considered to be ‘up’. If there is no response or the response takes longer than 250 ms, the node is considered to be ‘down’. The results are available using the “sctool status” command.

Scylla Manager 1.3 Architecture, including the Monitoring Stack, and the new CQL base Health Check interface to Scylla nodes.

If you have enabled the Scylla Monitoring stack, Monitoring stack 2.0 Manager dashboard includes the same cluster status report. A new Alert was defined in Prometheus Alert Manager, to report when a Scylla node health check fails and the node is considered ‘down’.

Example of Manager 1.3 Dashboard, including an active repair running, and Health Check reports of all nodes responding to CQL.

Related links:

Upgrade to Scylla Manager 1.3

Read the upgrade guide carefully. In particular, you will need to redefine scheduled repairs. Please contact Scylla Support team for help in installing and upgrading Scylla Manager.

Monitoring

Scylla Grafana Monitoring 2.0 now includes the Scylla Manager 1.3 dashboard

About Scylla Manager

Scylla Manager adds centralized cluster administration and recurrent task automation to Scylla Enterprise. Scylla Manager 1.x includes automation of periodic repair. Future releases will provide rolling upgrades, recurrent backup, and more. With time, Scylla Manager will become the focal point of Scylla Enterprise cluster management, including a GUI front end. Scylla Manager is available for all Scylla Enterprise customers. It can also be downloaded from scylladb.com for a 30-day trial.

The post Scylla Manager 1.3 Release Announcement appeared first on ScyllaDB.

Going Head-to-Head: Scylla vs Amazon DynamoDB

$
0
0
Going Head-to-Head: Scylla vs Amazon DynamoDB

“And now for our main event! Ladies and gentlemen, in this corner, weighing in at 34% of the cloud infrastructure market, the reigning champion and leader of the public cloud…. Amazon!” Amazon has unparalleled expertise at maximizing scalability and availability for a vast array of customers using a plethora of software products. While Amazon offers software products like DynamoDB, it’s database-as-a-service is only one of their many offerings.

“In the other corner is today’s challenger — young, lightning quick and boasting low-level Big Data expertise… ScyllaDB!” Unlike Amazon, our company focuses exclusively on creating the best database for distributed data solutions.

A head-to-head database battle between Scylla and DynamoDB is a real David versus Goliath situation. It’s Rocky Balboa versus Apollo Creed. Is it possible Scylla could deliver an unexpected knockout punch against DynamoDB? [SPOILER ALERT: Our results will show Scylla has 1/4th the latencies and is only 1/7th the cost of DynamoDB — and this is in the most optimized case for Dynamo. Watch closely as things go south for Dynamo in Round 6. Please keep reading to see how diligent we were in creating a fair test case and other surprise outcomes from our benchmark battle royale.]

To be clear, Scylla is not a competitor to AWS at all. Many of our customers deploy Scylla to AWS, we ourselves find it to be an outstanding platform, and on more than one occasion we’ve blogged about its unique bare metal instances. Here’s further validation — our Scylla Cloud service runs on top of AWS. But we do think we might know a bit more about building a real-time big data database, so we limited the scope of this competitive challenge solely to Scylla versus DynamoDB, database-to-database.

Scylla is a drop-in replacement for Cassandra, implemented from scratch in C++. Cassandra itself was a reimplementation of concepts from the Dynamo paper. So, in a way, Scylla is the “granddaughter” of Dynamo. That means this is a family fight, where a younger generation rises to challenge an older one. It was inevitable for us to compare ourselves against our “grandfather,” and perfectly in keeping with the traditions of Greek mythology behind our name.

If you compare Scylla and Dynamo, each has pros and cons, but they share a common class of NoSQL database: Column family with wide rows and tunable consistency. Dynamo and its Google counterpart, Bigtable, were the first movers in this market and opened up the field of massively scalable services — very impressive by all means.

Scylla is much younger opponent, just 4.5 years in age. Though Scylla is modeled on Cassandra, Cassandra was never our end goal, only a starting point. While we stand on the shoulders of giants in terms of existing design, our proven system programing abilities have come heavily into play and led to performance to the level of a million operations per second per server. We recently announced feature parity (minus transactions) with Cassandra, and also our own database-as-a-service offering, Scylla Cloud.

But for now we’ll focus on the question of the day: Can we take on DynamoDB?

Rules of the Game

With our open source roots, our culture forces us to be fair as possible. So we picked a reasonable benchmark scenario that’s supposed to mimic the requirements of a real application and we will judge the two databases from the user perspective. For the benchmark we used Yahoo! Cloud Serving Benchmark (YCSB) since it’s a cross-platform tool and an industry standard. The goal was to meet a Service Level Agreement of 120K operations per second with a 50:50 read/write split (YCSB’s workload A) with a latency under 10ms in the 99% percentile. Each database would provision the minimal amount of resources/money to meet this goal. Each DB should be populated first with 1 billion rows using the default, 10 column schema of YCSB.

We conducted our tests using Amazon DynamoDB and Amazon Web Services EC2 instances as loaders. Scylla also used Amazon Web Services EC2 instances for servers, monitoring tools and the loaders.

These tests were conducted on Scylla Open Source 2.1, which is the code base for Scylla Enterprise 2018.1. Thus performance results for these tests will hold true across both Open Source and Enterprise. However, we use Scylla Enterprise for comparing Total Cost of Ownership

DynamoDB is known to be tricky when the data distribution isn’t uniform, so we selected uniform distribution to test Dynamo within its sweet spot. We set 3 nodes of i3.8xl for Scylla, with replication of 3 and quorum consistency level, loaded the 1 TB dataset (replicated 3 times) and after 2.5 hours it was over, waiting for the test to begin.

Scylla Enterprise Amazon DynamoDB
Scylla Cluster
  • i3.8xlarge | 32 vCPU | 244 GiB | 4 x 1.9TB NVMe
  • 3-node cluster on single DC | RF=3
  • Dataset: ~1.1TB (1B partitions / size: ~1.1Kb)
  • Total used storage: ~3.3TB
Provisioned Capacity
  • 160K write | 80K read (strong consistency)
  • Dataset: ~1.1TB (1B partitions / size: ~1.1Kb)
  • Storage size: ~1.1 TB (DynamoDB table metrics)
  • Workload-A: 90 min, using 8 YCSB clients, every client runs on its own data range (125M partitions)
  • Loaders: 4 x m4.2xlarge (8 vCPU | 32 GiB RAM), 2 loaders per machine
  • Scylla workloads runs with Consistency Level = QUORUM for writes and reads.
  • Scylla starts with a cold cache in all workloads.
  • DynamoDB workloads ran with dynamodb.consistentReads = true
  • Sadly for DynamoDB, each item weighted 1.1kb – YCSB default schema, thus each write originated in two accesses

Let the Games Begin!

We started to populate Dynamo with the dataset. However, not so fast..

High Rate of InternetServerError

Turns out the population stage is hard on DynamoDB. We had to slow down the population rate time and again, despite it being well within the reserved IOPS. Sometimes we managed to populate up to 0.5 billion rows before we started to receive the errors again.

Each time we had to start over to make sure the entire dataset was saved. We believe DynamoDB needs to break its 10GB partitions through the population and cannot do it in parallel to additional load without any errors. The gory details:

  • Started population with Provisioned capacity: 180K WR | 120K RD.
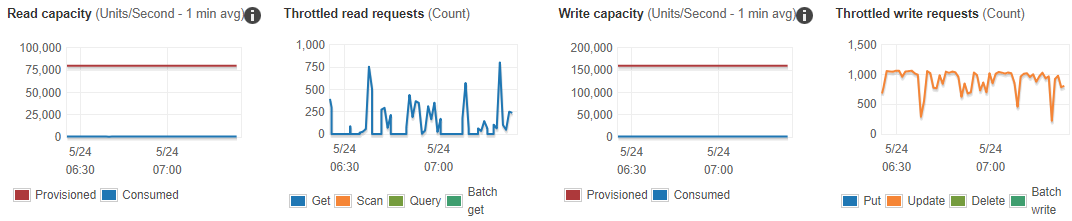
    • ⚠ We hit errors on ~50% of the YCSB threads causing them to die when using ≥50% of write provisioned capacity.
    • For example, it happened when we ran with the following throughputs:
      • 55 threads per YCSB client = ~140K throughput (78% used capacity)
      • 45 threads per YCSB client = ~130K throughput (72% used capacity)
      • 35 threads per YCSB client = ~96K throughput (54% used capacity)

After multiple attempts with various provisioned capacities and throughputs, eventually a streaming rate was found that permitted a complete database population. Here are the results of the population stage:

YCSB Workload / DescriptionScylla Open Source 2.1 (3x i3.8xlarge)
8 YCSB Clients
DynamoDB (160K WR | 80K RD)
8 YCSB clients
Population
100% Write

Range
1B partitions (~1.1Kb)

Distribution:

Uniform
Overall Throughput(ops/sec): 104K
Avg Load (scylla-server): ~85%

INSERT operations (Avg): 125M
Avg. 95th Percentile Latency (ms): 8.4
Avg. 99th Percentile Latency (ms): 11.3
Overall Throughput(ops/sec): 51.7K
Max Consumed capacity: WR 75%

INSERT operations (Avg): 125M
Avg. 95th Percentile Latency (ms): 7.5
Avg. 99th Percentile Latency (ms): 11.6

Scylla completed the population at twice the speed but more importantly, worked out of the box without any errors or pitfalls.

YCSB Workload A, Uniform Distribution

Finally, we began the main test, the one that gauges our potential user workload with an SLA of 120,000 operations. This scenario is supposed to be DynamoDB’s sweet spot. The partitions are well balanced and the load isn’t too high for DynamoDB to handle. Let’s see the results:

YCSB Workload /
Description
Scylla Open Source 2.1 (3x i3.8xlarge)
8 YCSB Clients
DynamoDB (160K WR | 80K RD)
8 YCSB clients
Workload A
50% Read / 50% Write

Range
1B partitions (~1.1Kb)

Distribution:
Uniform

Duration: 90 min.
Overall Throughput(ops/sec): 119.1K
Avg Load (scylla-server): ~58%

READ operations (Avg): ~39.93M
Avg. 95th Percentile Latency (ms): 5.0
Avg. 99th Percentile Latency (ms): 7.2

UPDATE operations (Avg): ~39.93M
Avg. 95th Percentile Latency (ms): 3.4
Avg. 99th Percentile Latency (ms): 5.6
Overall Throughput(ops/sec): 120.1K
Avg Load (scylla-server): ~WR 76% | RD 76%

READ operations (Avg): ~40.53M
Avg. 95th Percentile Latency (ms): 12.0
Avg. 99th Percentile Latency (ms): 18.6

UPDATE operations (Avg): ~40.53M
Avg. 95th Percentile Latency (ms): 13.2
Avg. 99th Percentile Latency (ms): 20.2

After all the effort of loading the data, DynamoDB was finally able to demonstrate its value. DynamoDB met the throughput SLA (120k OPS). However, it failed to meet the latency SLA of 10ms for 99%, but after the population difficulties we were happy to get to this point.

Scylla on the other hand, easily met the throughput SLA, with only 58% load and latency. That was 3x-4x better than DynamoDB and well below our requested SLA. (Also, what you don’t see here is the huge cost difference, but we’ll get to that in a bit.)

We won’t let DynamoDB off easy, however. Now that we’ve seen how DynamoDB performs with its ideal uniform distribution, let’s have a look at how it behaves with a real life use-case.

Real Life Use-case: Zipfian Distribution

A good schema design goal is to have the perfect, uniform distribution of your primary keys. However, in real life, some keys are accessed more than others. For example, it’s common practice to use UUID for the customer or the product ID and to look them up. Some of the customers will be more active than others and some products will be more popular than others, so the differences in access times can go up to 10x-1000x. Developers cannot improve the situation in the general case since if you add an additional column to the primary key in order to improve the distribution, you may improve the specific access but at the cost of complexity when you retrieve the full information about the product/customer. 

Keep in mind what you store in a database. It’s data such as how many people use Quora or how many likes NBA teams have:

With that in mind, let’s see how ScyllaDB and DynamoDB behave given a Zipfian distribution access pattern. We went back to the test case of 1 billion keys spanning 1TB of pre-replicated dataset and queried it again using YCSB Zipfian accesses. It is possible to define the hot set of partitions in terms of volume — how much data is in it — and define the percentile of access for this hot set as part from the overall 1TB set.

We set a variety of parameters for the hot set and the results were pretty consistent – DynamoDB could not meet the SLA for Zipfian distribution. It performed well below its reserved capacity — only 42% utilization — but it could not execute 120k OPS. In fact, it could do only 65k OPS. The YCSB client experienced multiple, recurring ProvisionedThroughputExceededException (code: 400) errors, and throttling was imposed by DynamoDB.

YCSB Workload /
Description
Scylla 2.1 (3x i3.8xlarge)
8 YCSB Clients
DynamoDB (160K WR | 80K RD)
8 YCSB clients
Workload A
50% Read / 50% Write

Range: 
1B partitions

Distribution: Zipfian

Duration: 90 min.

Hot set: 10K partitions
Hot set access: 90%
Overall Throughput(ops/sec): 120.2K
Avg Load (scylla-server): ~55%

READ operations (Avg): ~40.56M
Avg. 95th Percentile Latency (ms): 6.1
Avg. 99th Percentile Latency (ms): 8.6

UPDATE operations (Avg): ~40.56M
Avg. 95th Percentile Latency (ms): 4.4
Avg. 99th Percentile Latency (ms): 6.6
Overall Throughput(ops/sec): 65K
Avg Load (scylla-server): ~WR 42% | RD 42%

READ operations (Avg): ~21.95M
Avg. 95th Percentile Latency (ms): 6.0
Avg. 99th Percentile Latency (ms): 9.2

UPDATE operations (Avg): ~21.95M
Avg. 95th Percentile Latency (ms): 7.3
Avg. 99th Percentile Latency (ms): 10.8

Why can’t DynamoDB meet the SLA in this case? The answer lies within the Dynamo model. The global reservation is divided to multiple partitions, each no more than 10TB in size.

DynamoDB partition equations

This when such a partition is accessed more often it may reach its throttling cap even though overall you’re well within your global reservation. In the example above, when reserving 200 writes, each of the 10 partitions cannot be queried more than 20 writes/s

The Dress that Broke DynamoDB

If you asked yourself, “Hmmm, is 42% utilization the worst I’d see from DynamoDB?” we’re afraid we have some bad news for you. Remember the dress that broke the internet? What if you have an item in your database that becomes extremely hot? To explore this, we tested a single hot partition access and compared it.

The Dress that Broke the Internet

We ran a single YCSB, working on a single partition on a 110MB dataset (100K partitions). During our tests, we observed a DynamoDB limitation when a specific partition key exceeded 3000 read capacity units (RCU) and/or 1000 write capacity units (WCU).

Even when using only ~0.6% of the provisioned capacity (857 OPS), the YCSB client experienced ProvisionedThroughputExceededException (code: 400) errors, and throttling was imposed by DynamoDB (see screenshots below).

It’s not that we recommend not planning for the best data model. However, there will always be cases when your plan is far from reality. In the Scylla case, a single partition still performed reasonably well: 20,200 OPS with good 99% latency.

Scylla vs DynamoDB – Single (Hot) Partition

YCSB Workload /
Description
Scylla 2.1 (3x i3.8xlarge)
8 YCSB Clients
DynamoDB (160K WR | 80K RD)
8 YCSB clients
Workload A
50% Read / 50% Write

Range:

Single partition (~1.1Kb)

Distribution: Uniform

Duration: 90 min.
Overall Throughput(ops/sec): 20.2K
Avg Load (scylla-server): ~5%

READ operations (Avg): ~50M
Avg. 95th Percentile Latency (ms): 7.3
Avg. 99th Percentile Latency (ms): 9.4

UPDATE operations (Avg): ~50M
Avg. 95th Percentile Latency (ms): 2.7
Avg. 99th Percentile Latency (ms): 4.5
Overall Throughput(ops/sec): 857
Avg Load (scylla-server): ~WR 0.6% | RD 0.6%

READ operations (Avg): ~2.3M
Avg. 95th Percentile Latency (ms): 5.4
Avg. 99th Percentile Latency (ms): 10.7

UPDATE operations (Avg): ~2.3M
Avg. 95th Percentile Latency (ms): 7.7
Avg. 99th Percentile Latency (ms): 607.8
Screenshot 1: Single partition.

Screenshot 1: Single partition. Consumed capacity: ~0.6% -> Throttling imposed by DynamoDB

Additional Factors

Cross-region Replication and Global Tables

We compared the replication speed between datacenters and a simple comparison showed that DynamoDB replicated in 370ms on average to a remote DC while Scylla’s average was 82ms. Since the DynamoDB cross-region replication is built on its streaming api, we believe that when congestion happens, the gap will grow much further into a multi-second gap, though we haven’t yet tested it.

Beyond replication propagation, there is a more burning functional difference — Scylla can easily add regions on demand at any point in the process with a single command:

ALTER KEYSPACE mykespace WITH replication = { 'class' : 'NetworkTopologyStrategy', 'replication_factor': '3', '<exiting_dc>' : 3, <new_dc> : 4};

In DynamoDB, on the other hand, you must define your global tables ahead of time. This imposes a serious usability issue and a major cost one as you may need to grow the amount of deployed datacenters over time.

Why start with global Tables..? (quote)

Explicit Caching is Expensive and Bad for You

DynamoDB performance can improve and its high cost can be reduced in some cases when using DAX. However, Scylla has a much smarter and more efficient embedded cache (the database nodes have memory, don’t they?) and the outcome is far better for various reasons we described in a recent blog post.

Freedom

This is another a major advantage of Scylla — DynamoDB locks you to the AWS cloud, significantly decreasing your chances of ever moving out. Data gravity is significant. No wonder they’re going after Oracle!

Scylla is an open source database. You have the freedom to choose between our community version, an Enterprise version and our new fully managed service. Scylla runs on all major cloud providers and opens the opportunity for you to run some datacenters on one provider and others on another provider within the same cluster. One of our telco customers is a great example of the hybrid model — they chose to run some of their datacenters on-premise and some on AWS.

Our approach for “locking-in” users is quite different — we do it solely by the means of delivering quality and value such that you won’t want to move away from us. As of today, we have experienced exactly zero customer churn.

No Limits

DynamoDB imposes various limits on the size of each cell — only 400kb. In Scylla you can effectively store megabytes. One of our customers built a distributed storage system using Scylla, keeping large blobs in Scylla with single-digit millisecond latency for them too.

Another problematic limit is the sort key amount, DynamoDB cannot hold more than 10GB items. While this isn’t a recommended pattern in Scylla either, we have customers who keep 130GB items in a single partition. The effect of these higher limits is more freedom in data modeling and fewer reasons to worry. 

Total Cost of Ownership (TCO)

We’re confident the judges would award every round of this battle to Scylla so far, and we haven’t even gotten to comparing the total cost of ownership. The DynamoDB setup, which didn’t even meet the required SLA and which caused us to struggle multiple times to even get working, costs 7 times more than the comparable Scylla setup.

Scylla Enterprise
(3 x i3.8xlarge + Scylla Enterprise license)
Amazon DynamoDB
(160K write | 80K Read + Business-level Support)

Year-term Estimated Cost: ~$71K

Year-term Estimated Cost: ~$524K

  • DynamoDB 1-year term: ~$288K
  • Monthly fee : ~$19.7K/month (~236K annual)

Note that only 3 machines were needed for Scylla; not much of a challenge in terms of administration. And, as we mentioned earlier, you can offload all your database administration with our new fully managed cloud service, Scylla Cloud. (By the way, Scylla Cloud comes in at 4-6x less expensive than DynamoDB, depending on the plan.)

Final Decision: A Knockout!

Uniform 99% ms Latency
Zipfian Distribution Throughput
  • DynamoDB failed to achieve the required SLA multiple times, especially during the population phase.
  • DynamoDB has 3x-4x the latency of Scylla, even under ideal conditions
  • DynamoDB is 7x more expensive than Scylla
  • Dynamo was extremely inefficient in a real-life Zipfian distribution. You’d have to buy 3x your capacity, making it 20x more expensive than Scylla
  • Scylla demonstrated up to 20x better throughput in the hot-partition test with better latency numbers
  • Last but not least, Scylla provides you freedom of choice with no cloud vendor lock-in (as Scylla can be run on various cloud vendors, or even on-premises).

Still not convinced? Listen to what our users have to say.

If you’d like to try your own comparison, remember that our product is open source. Feel free to download now. We’d love to hear from you if you have any questions about how we stack up or if you’d like to share your own results. And we’ll end with a final reminder that our Scylla Cloud (now available in Early Access) is built on Scylla Enterprise, delivering similar price-performance advantages while eliminating administrative overhead.

The post Going Head-to-Head: Scylla vs Amazon DynamoDB appeared first on ScyllaDB.

Viewing all 937 articles
Browse latest View live