This is part 8 of a series of blog posts that provides a story arc for Scylla Training.
In the past two posts, we expanded the Mutant Monitoring System across multiple datacenters and learned about the available consistency levels. With our infrastructure in place, we can move on to more important concepts like Monitoring. Krishna, the manager of the Fire and Ice Mutant division has set fire to a complete datacenter after he was mad about Deris, an in-memory mutant. Since DevOps hasn’t configured Scylla monitoring, no metrics to trigger an alarm were sent.
After this event, Division 3 decided that it was important to properly monitor all of the Scylla nodes so we can examine important details such as performance, latency, node availability, and more. In this post, we will use the Scylla Monitoring project to monitor our Scylla cluster.
About Scylla Monitoring
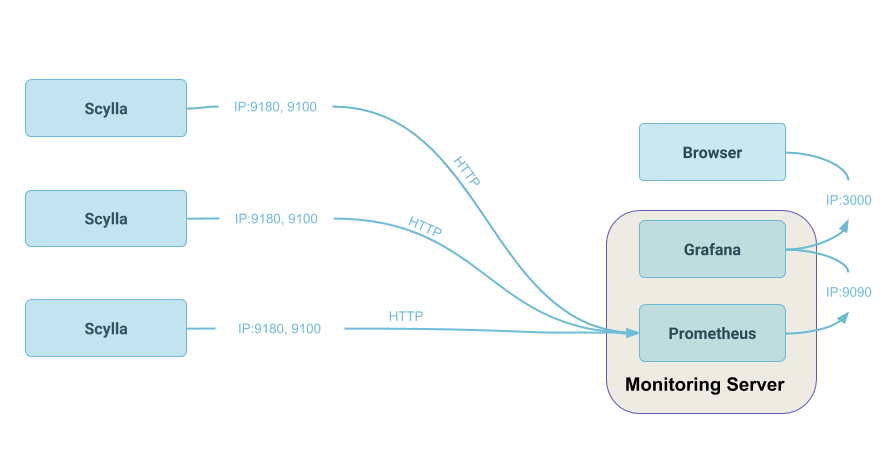
The Scylla Monitoring stack runs in Docker and consists of Prometheus and Grafana containers. Prometheus is an open source systems monitoring and alerting toolkit and is used to gather metrics from the Scylla cluster. Grafana is an open source analytics platform that will allow us to visualize the data in Graphs from Prometheus. Scylla Monitoring will be able to communicate with the Scylla cluster in this exercise because all of the components will be on the same virtual network.
With Scylla Monitoring, Division 3 can monitor Internal DB metrics such as load, throughput, latency, reads, writes, cache hits and misses, and more. Linux metrics are also recorded such as disk activity, utilization, and networking. To get started, we will first need to bring up our Scylla cluster.
Starting the Scylla Cluster
The Scylla Cluster should be up and running with the data imported from the previous blog posts. The MMS Git repository has been updated to provide the ability to automatically import the keyspaces and data. If you have the Git repository cloned already, you can simply do a “git pull” in the scylla-code-samples directory.
git clone https://github.com/scylladb/scylla-code-samples.git
cd scylla-code-samples/mms
Modify docker-compose.yml and add the following line under the environment: section of scylla-node1:
- IMPORT=IMPORT
Now the Scylla containers can be built and run with the following commands:
docker-compose build
docker-compose up -d
After roughly 60 seconds, the existing MMS data will be automatically imported. When the cluster is up and running, we can configure and start the Scylla Monitoring stack next.
Configuring and Starting Scylla Monitoring
From the scylla-code-samples directory, we will need to clone the scylla-grafana-monitoring Git repository:
cd scylla-code-samples/mms
git clone https://github.com/scylladb/scylla-grafana-monitoring.git
cd scylla-grafana-monitoring
Next, we will need to copy the configuration files and modified scripts used to make Scylla Monitoring work with the Mutant Monitoring System. Please note that in production, you should follow the official Scylla Monitoring documentation.
cp ../monitoring/scylla_servers.yml prometheus/
cp ../monitoring/start-grafana.sh .
cp ../monitoring/node_exporter_servers.yml prometheus/
cp ../monitoring/make_dashboards.py .
cp ../monitoring/start-all.sh .
mkdir datadir
With the configuration files in place, we can start Scylla Monitoring with the following commands:
./start-all.sh -d datadir
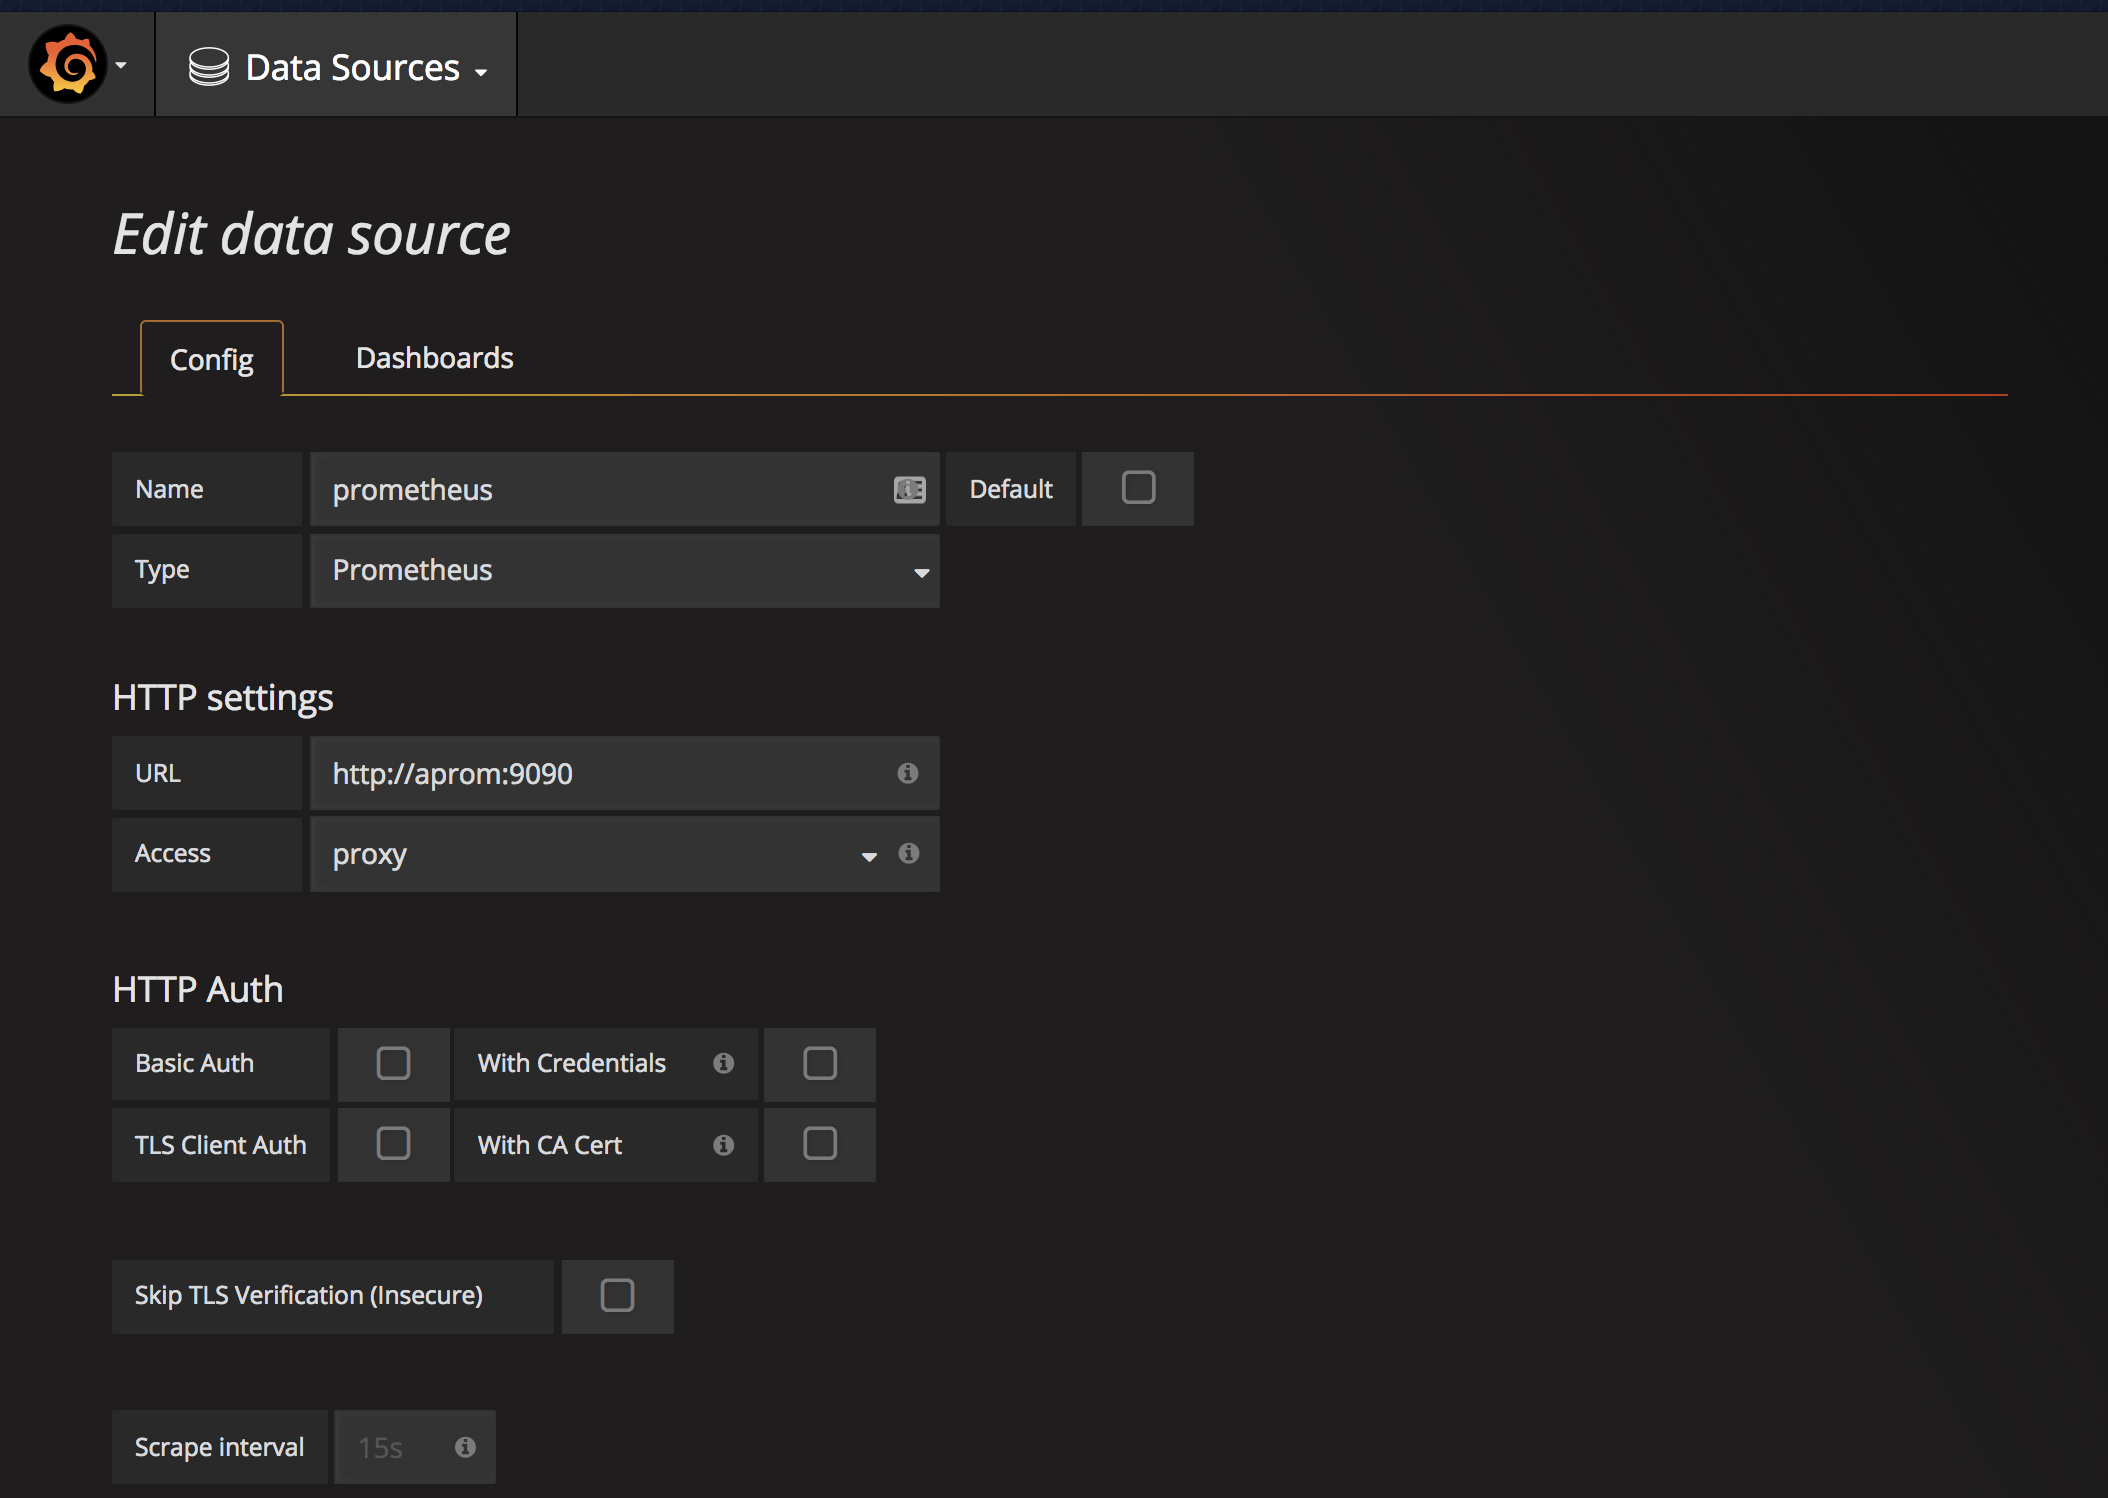
The Docker containers should be up and running now. Scylla Monitoring can be accessed in your web browser at http://127.0.0.1:3000/. The next step is to configure Grafana to communicate with Prometheus by clicking on the Grafana Logo followed by Data sources. Choose Prometheus and under HTTP settings, change URL to http://aprom:9090. Click save and test.
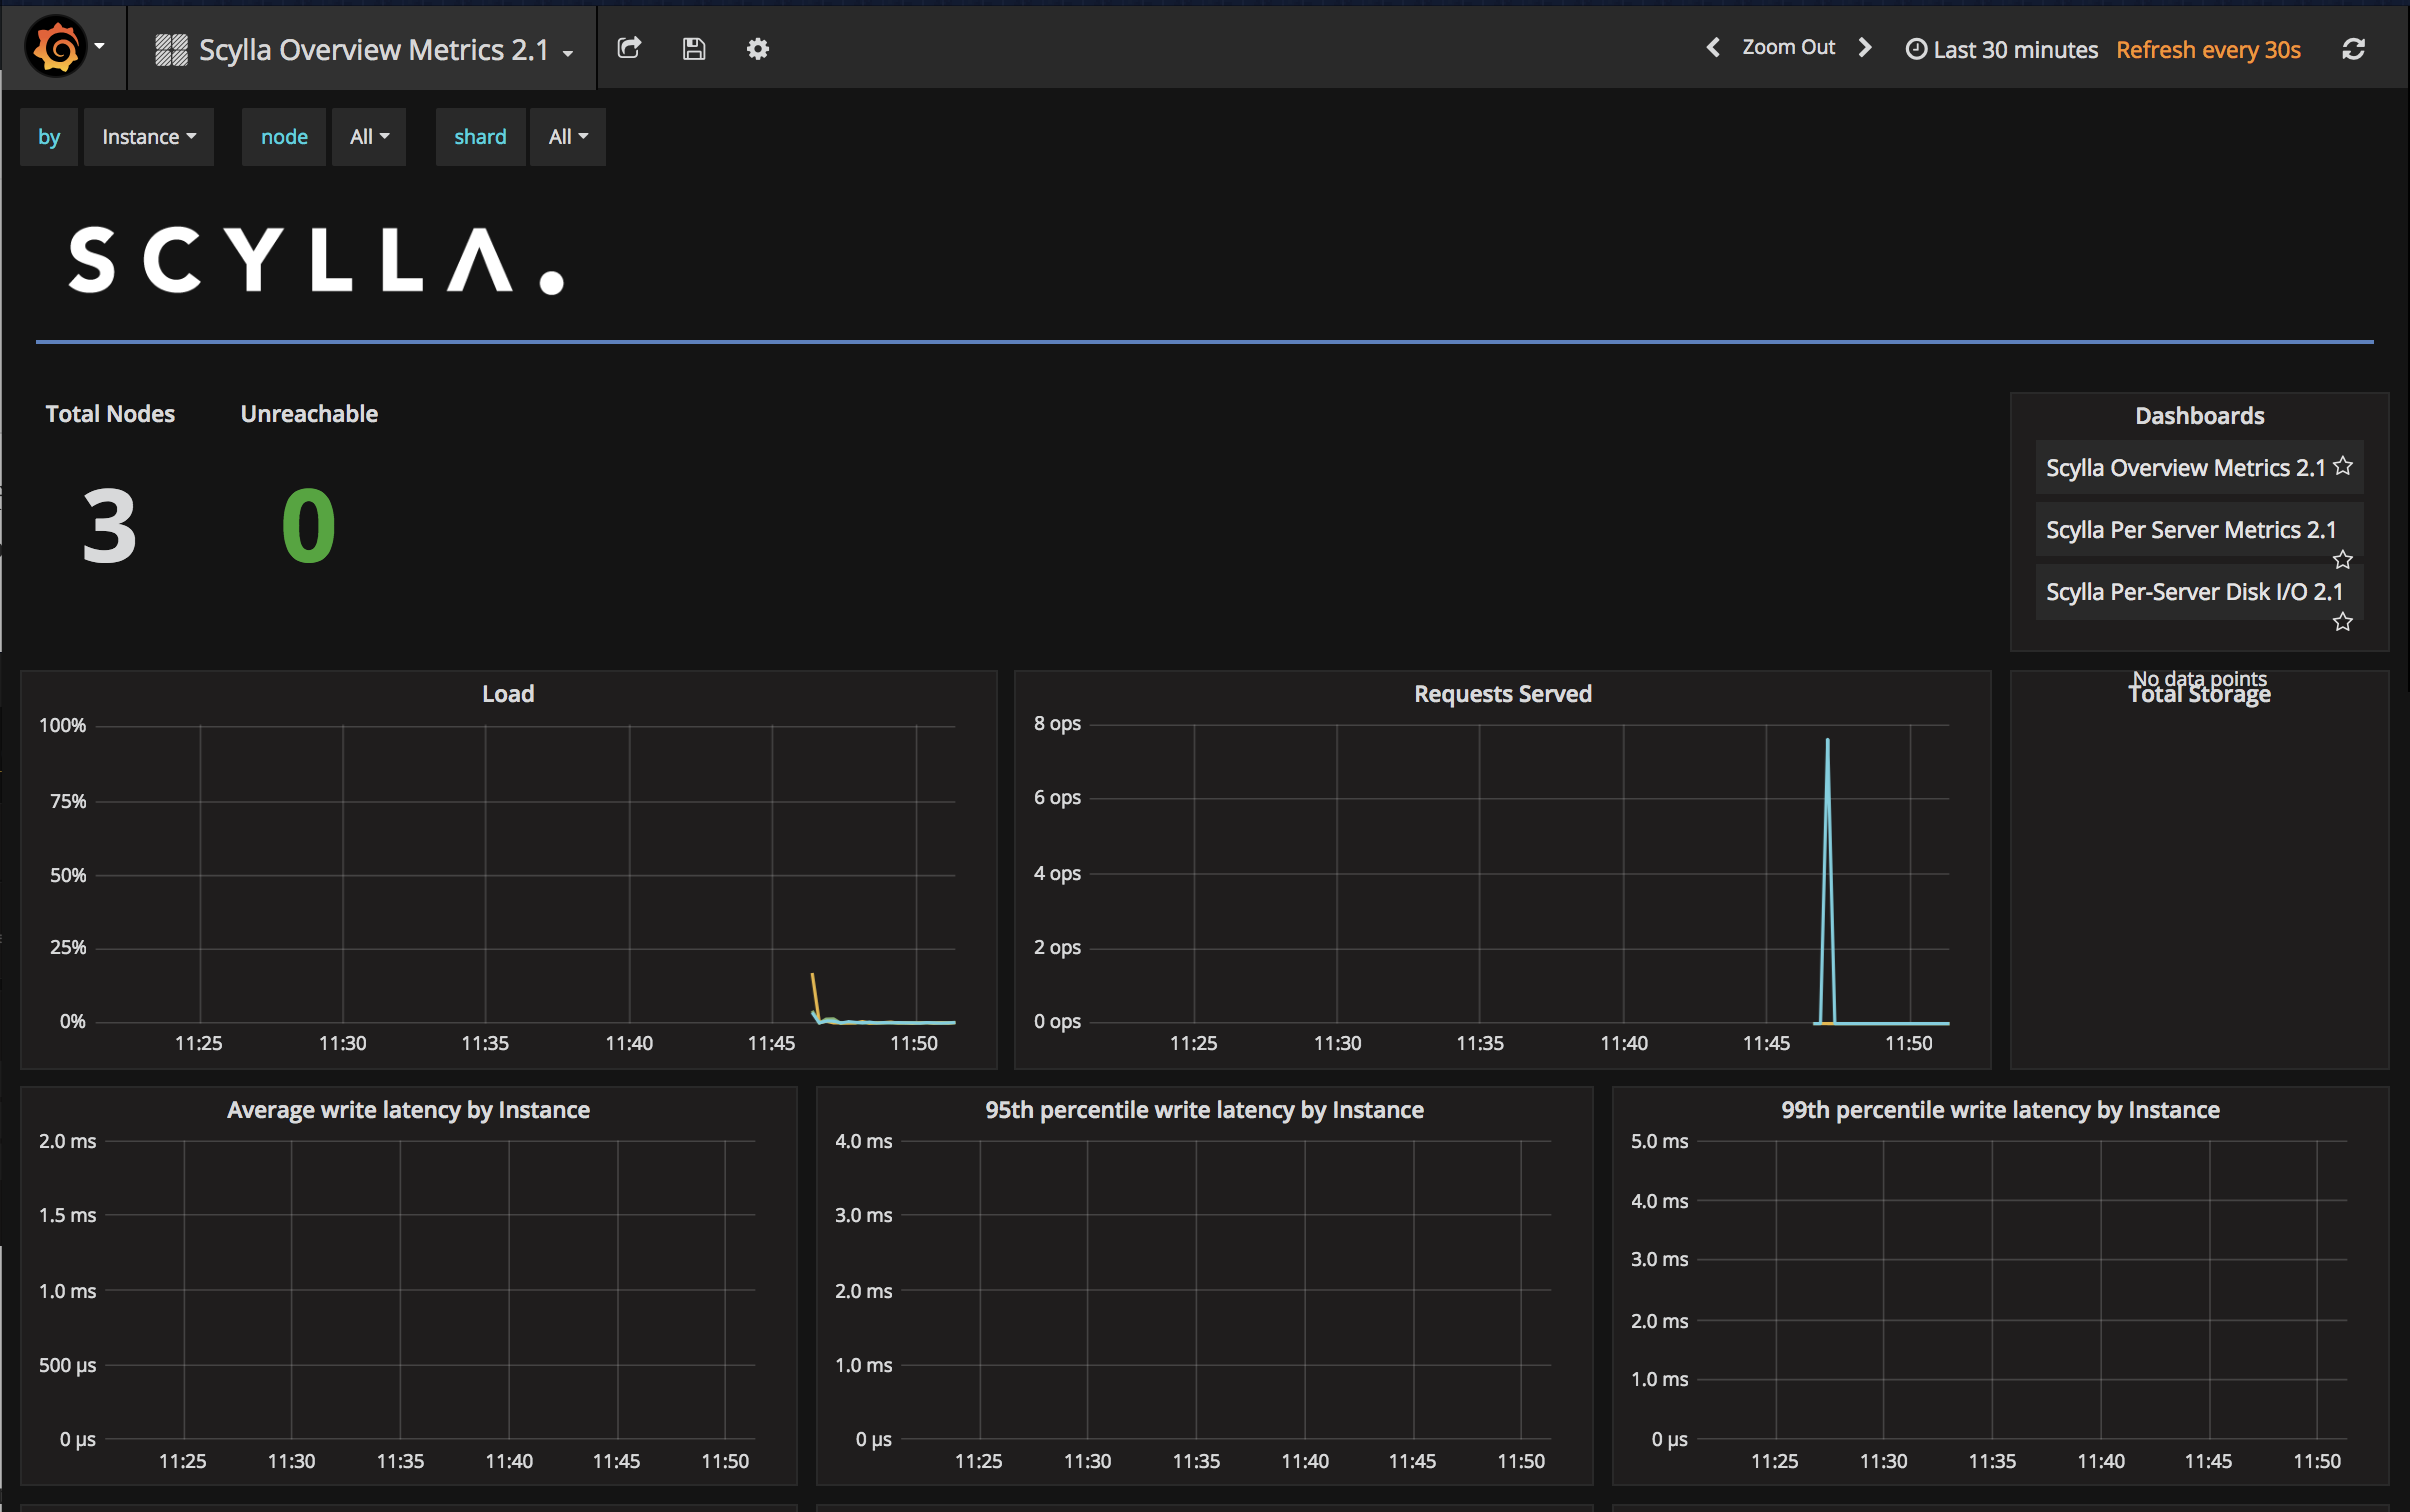
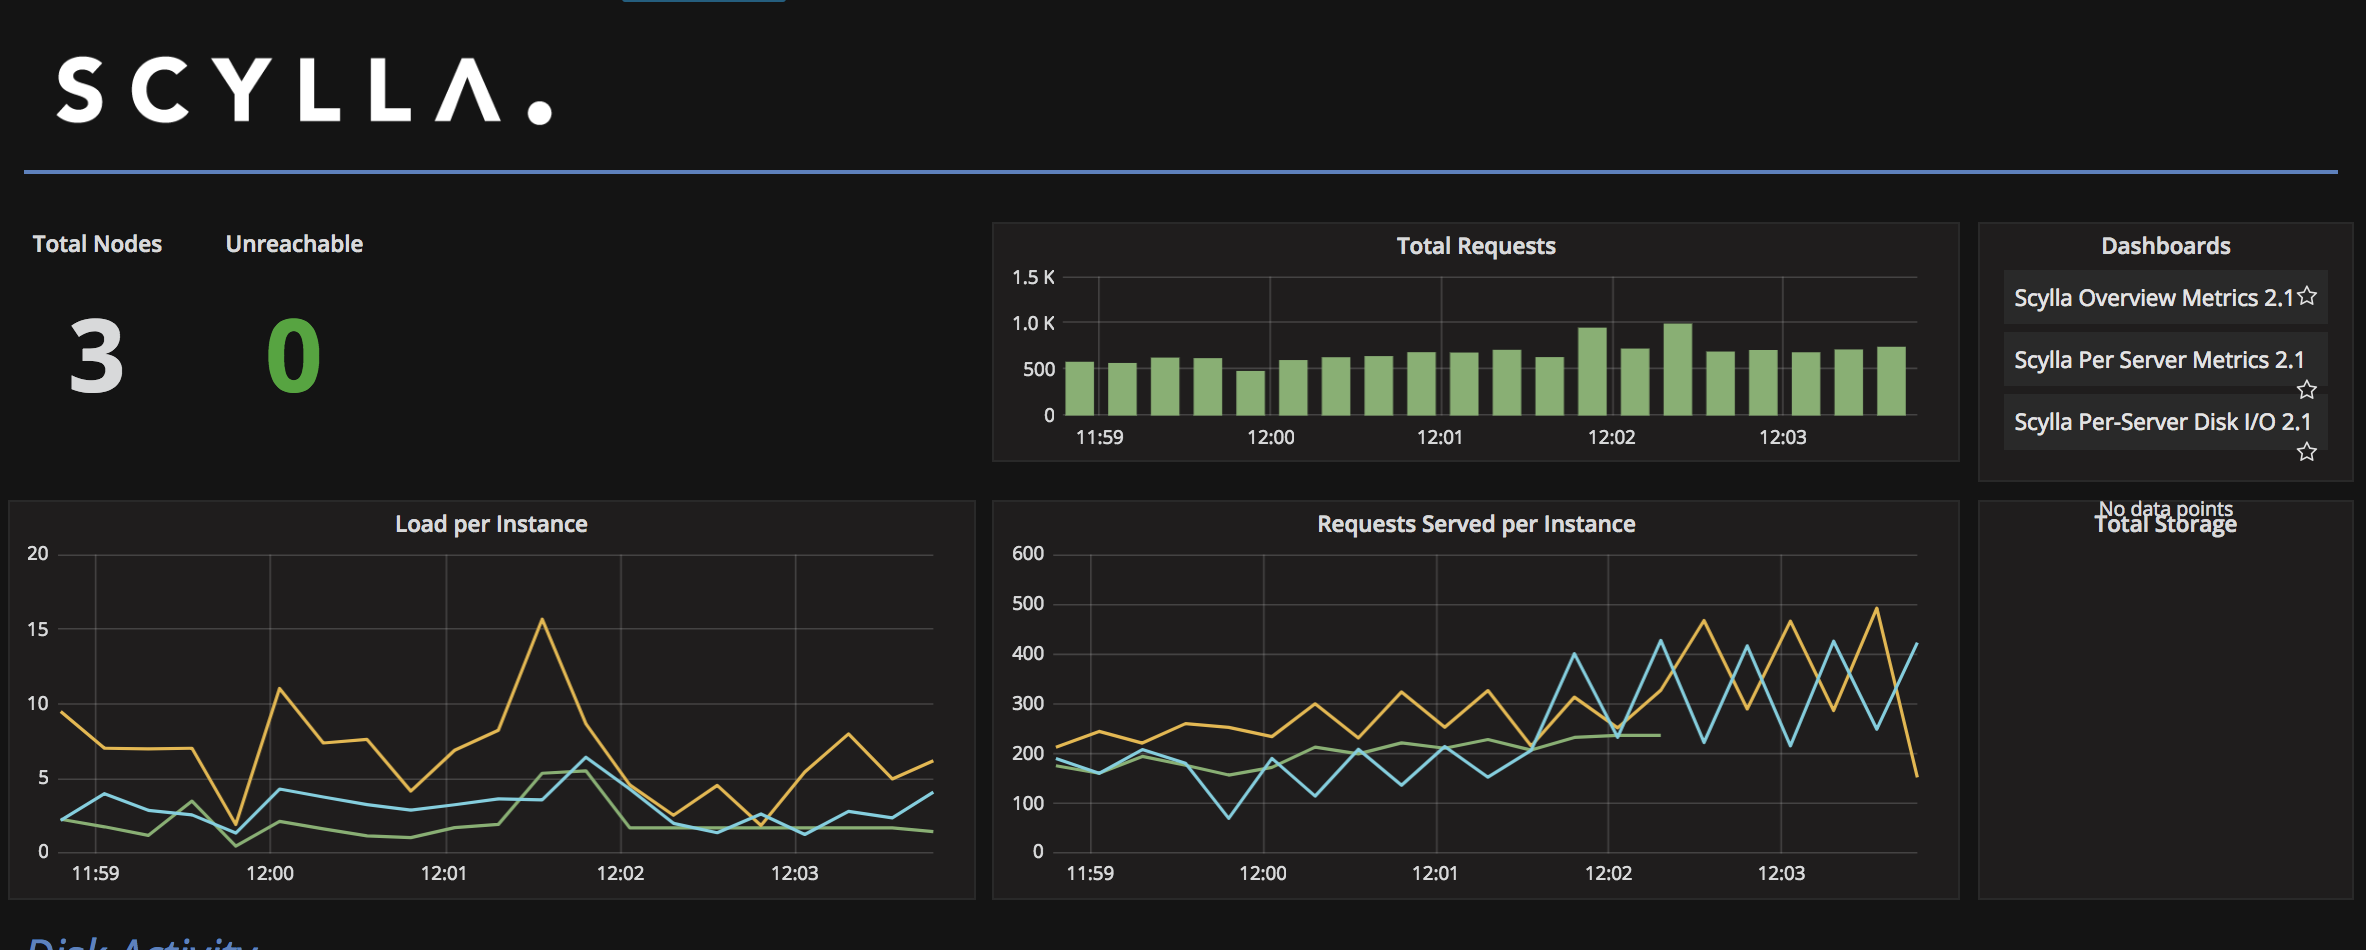
To view the metrics, click on the Grafana Logo followed by Dashboards. Next, click on Scylla Overview Metrics 2.1.
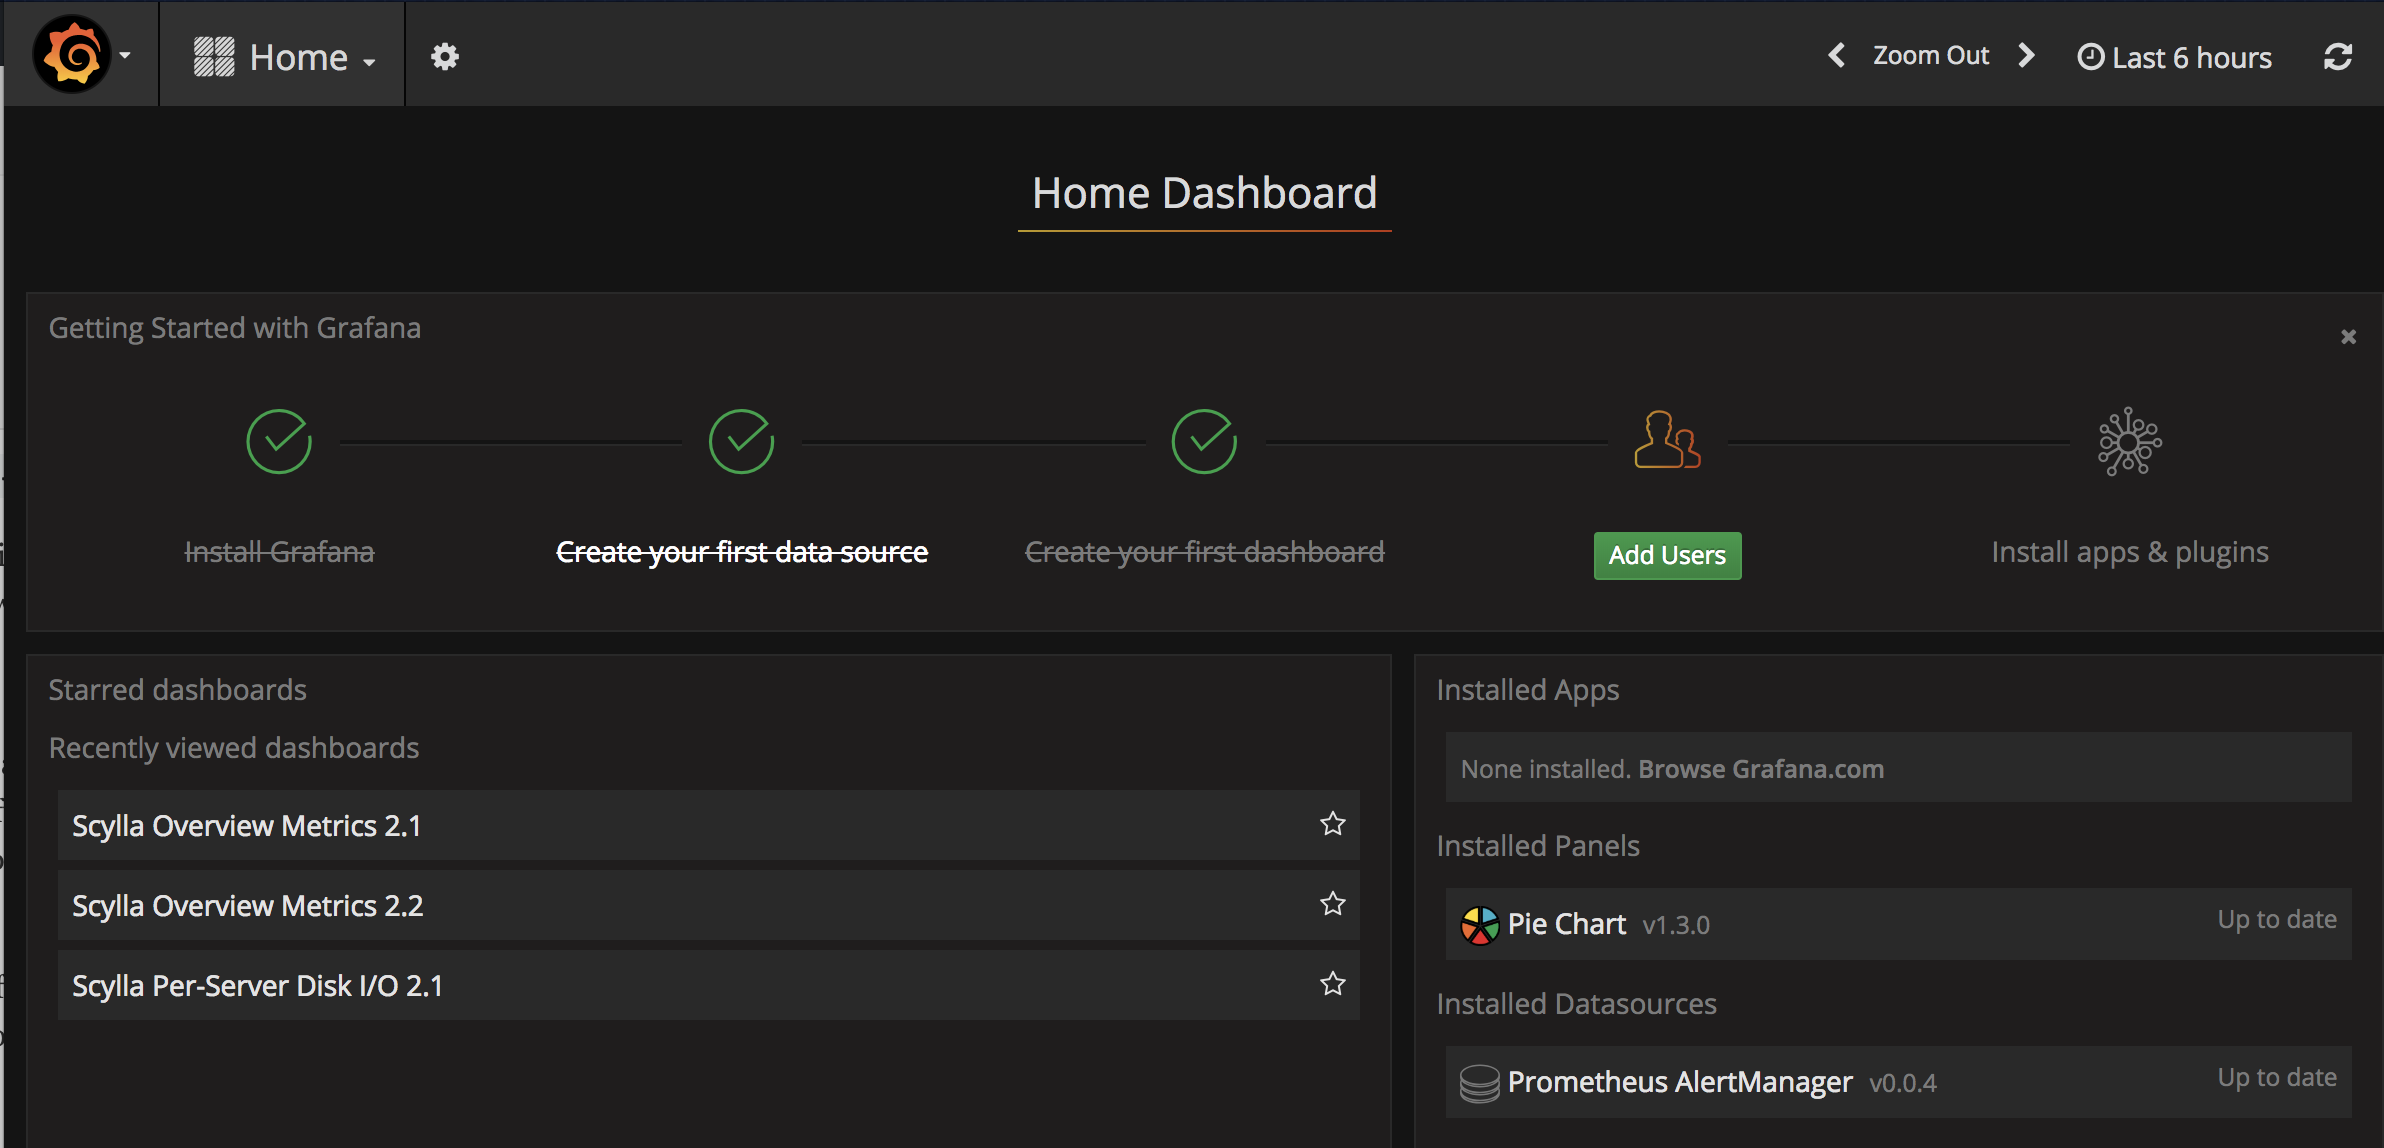
From this dashboard, you will be able to see useful information such as Total Requests, Load information, Disk Activity, and more. The problem now is that the graphs do not look that interesting because there is no activity on the cluster. To make the graphs pretty, let’s run a load generator.
Starting the Load Generator
The load generator is a simple Node.js application that will populate the tracking keyspace with data. To get started, we will first need to build the Docker container:
cd scylla-code-samples/mms/loadgen
docker build -t loadgen .
To start the load generator, run the following command:
docker run -d --net=mms_web --name loadgen loadgen
After 60 seconds, the load generator will begin populating the keyspace with data. You will be able to see when it starts by viewing the container logs:
docker logs -f loadgen
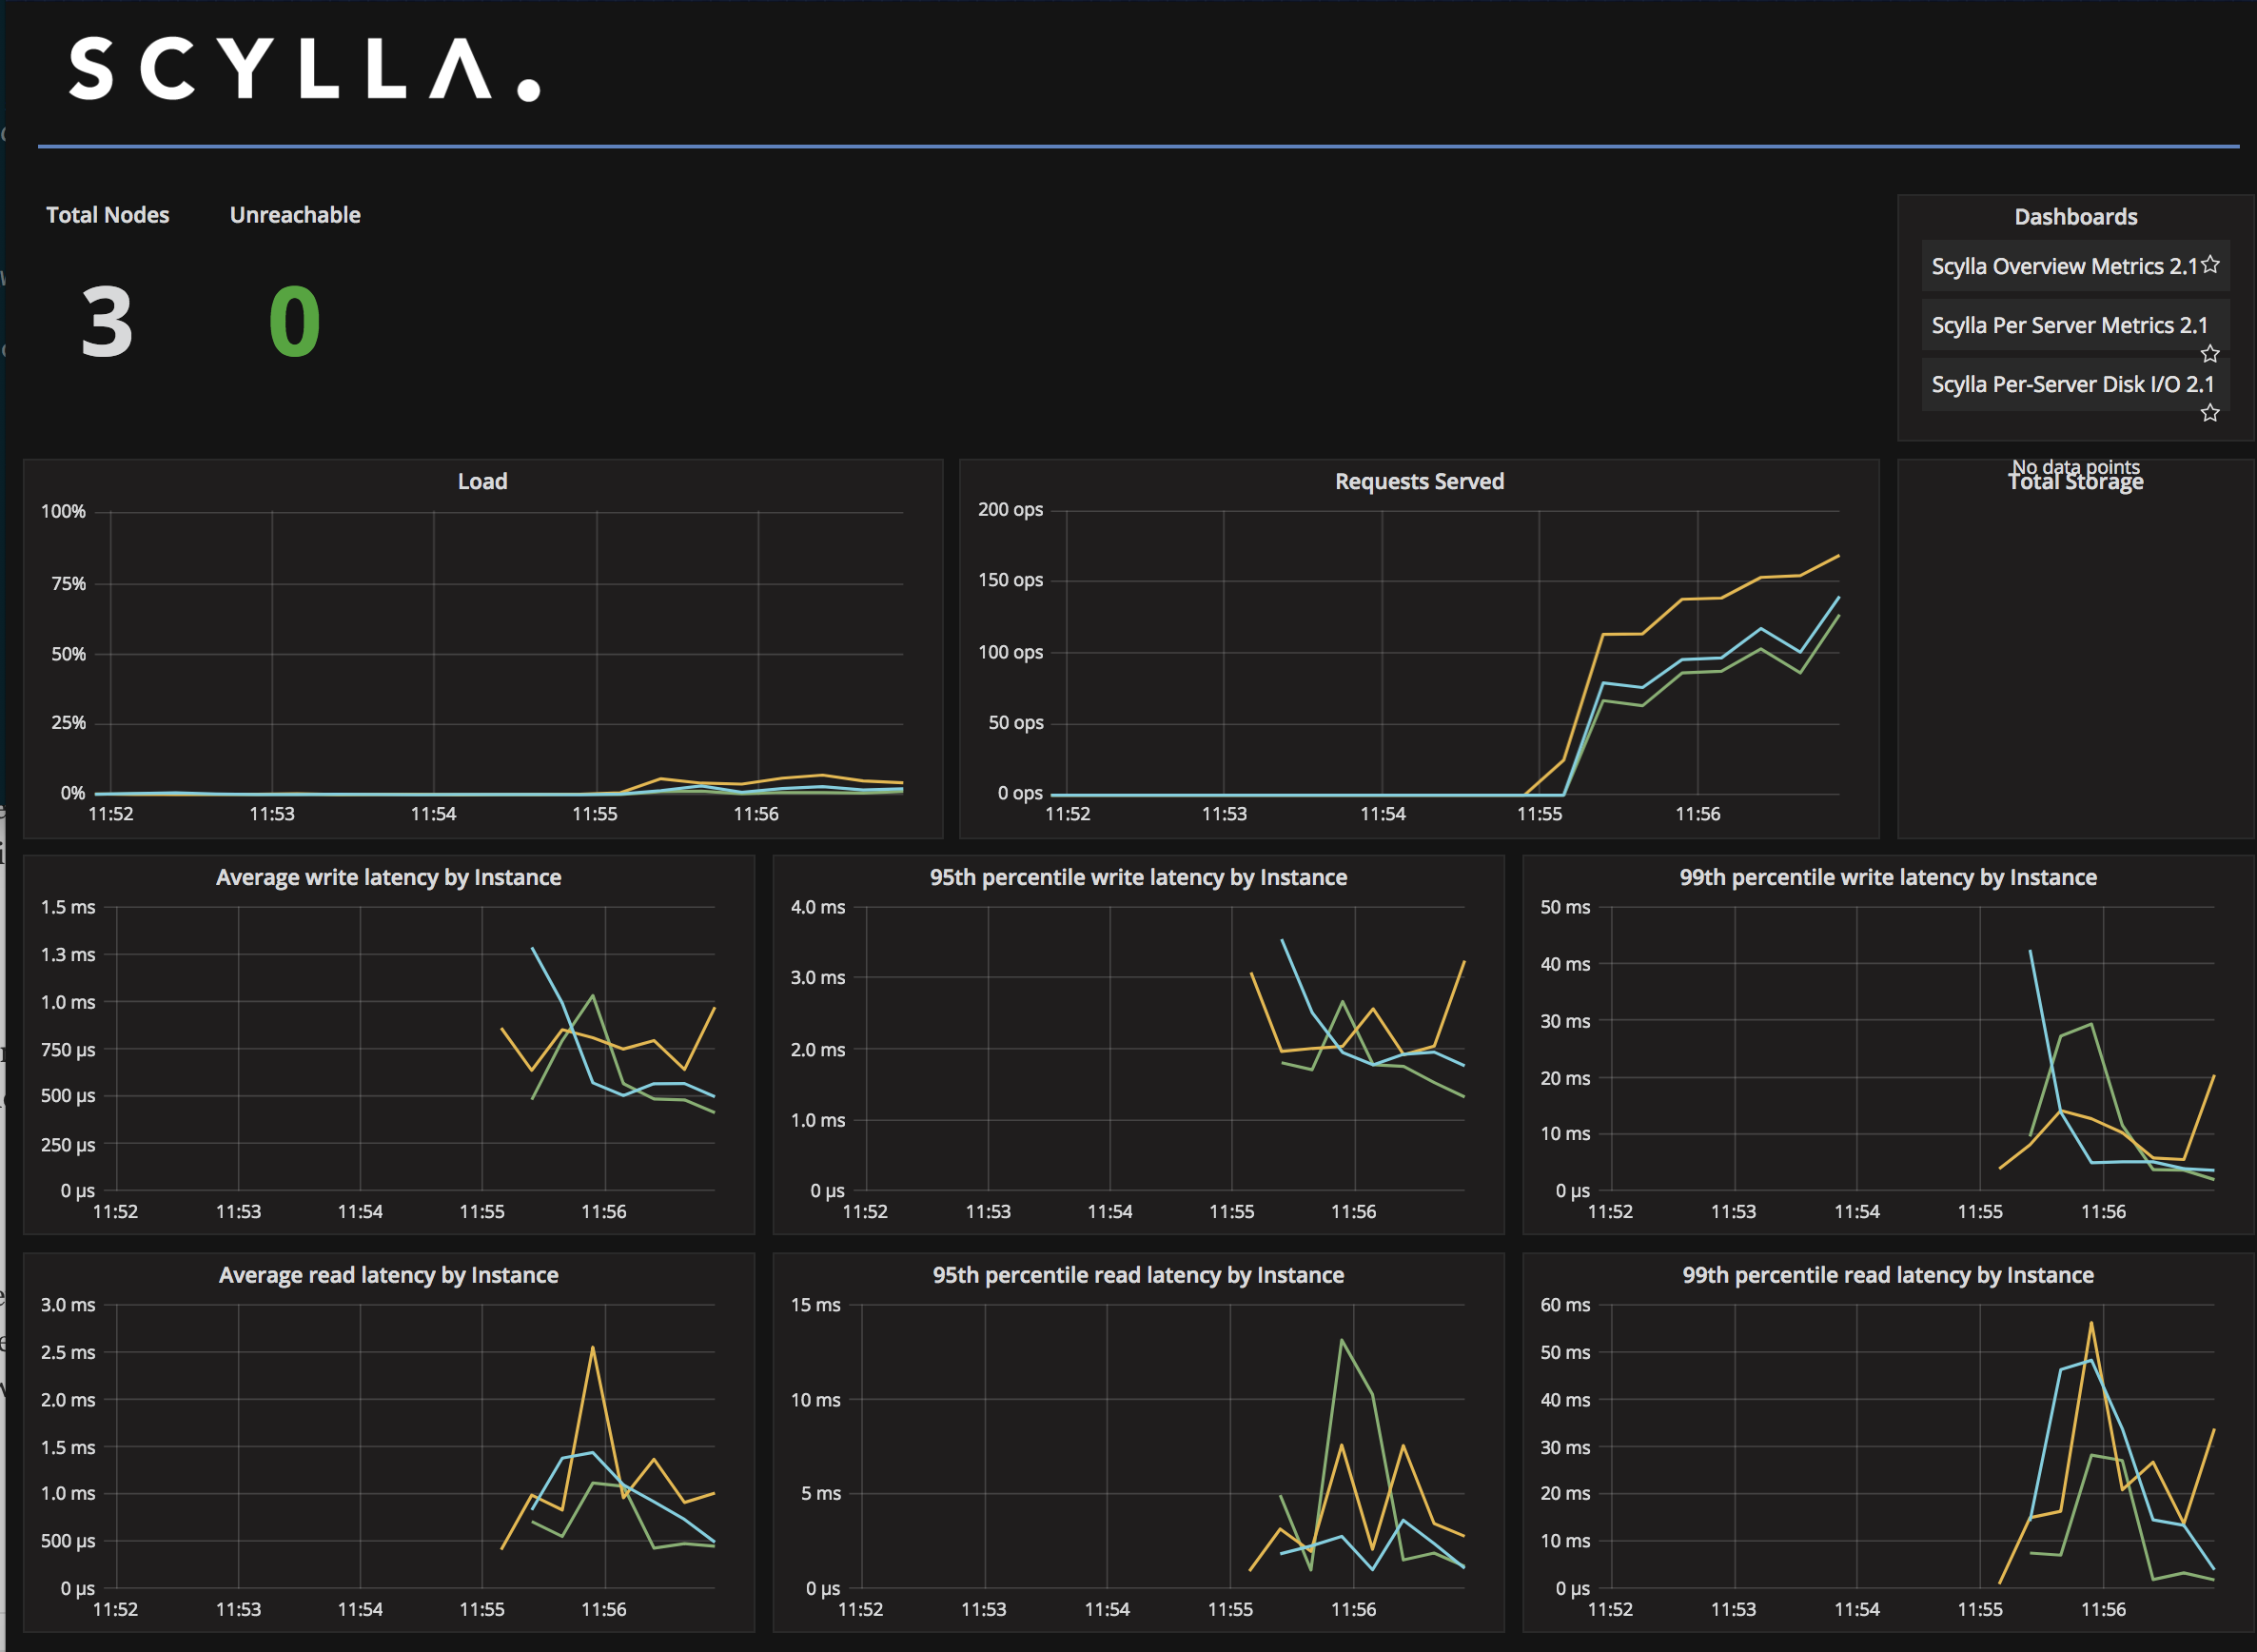
You can now switch back to the Grafana dashboard and the graphs should be more interesting and colorful than before. After a few minutes, they will be even better and we can begin to dive into Scylla Monitoring and see useful information about how MMS is running.
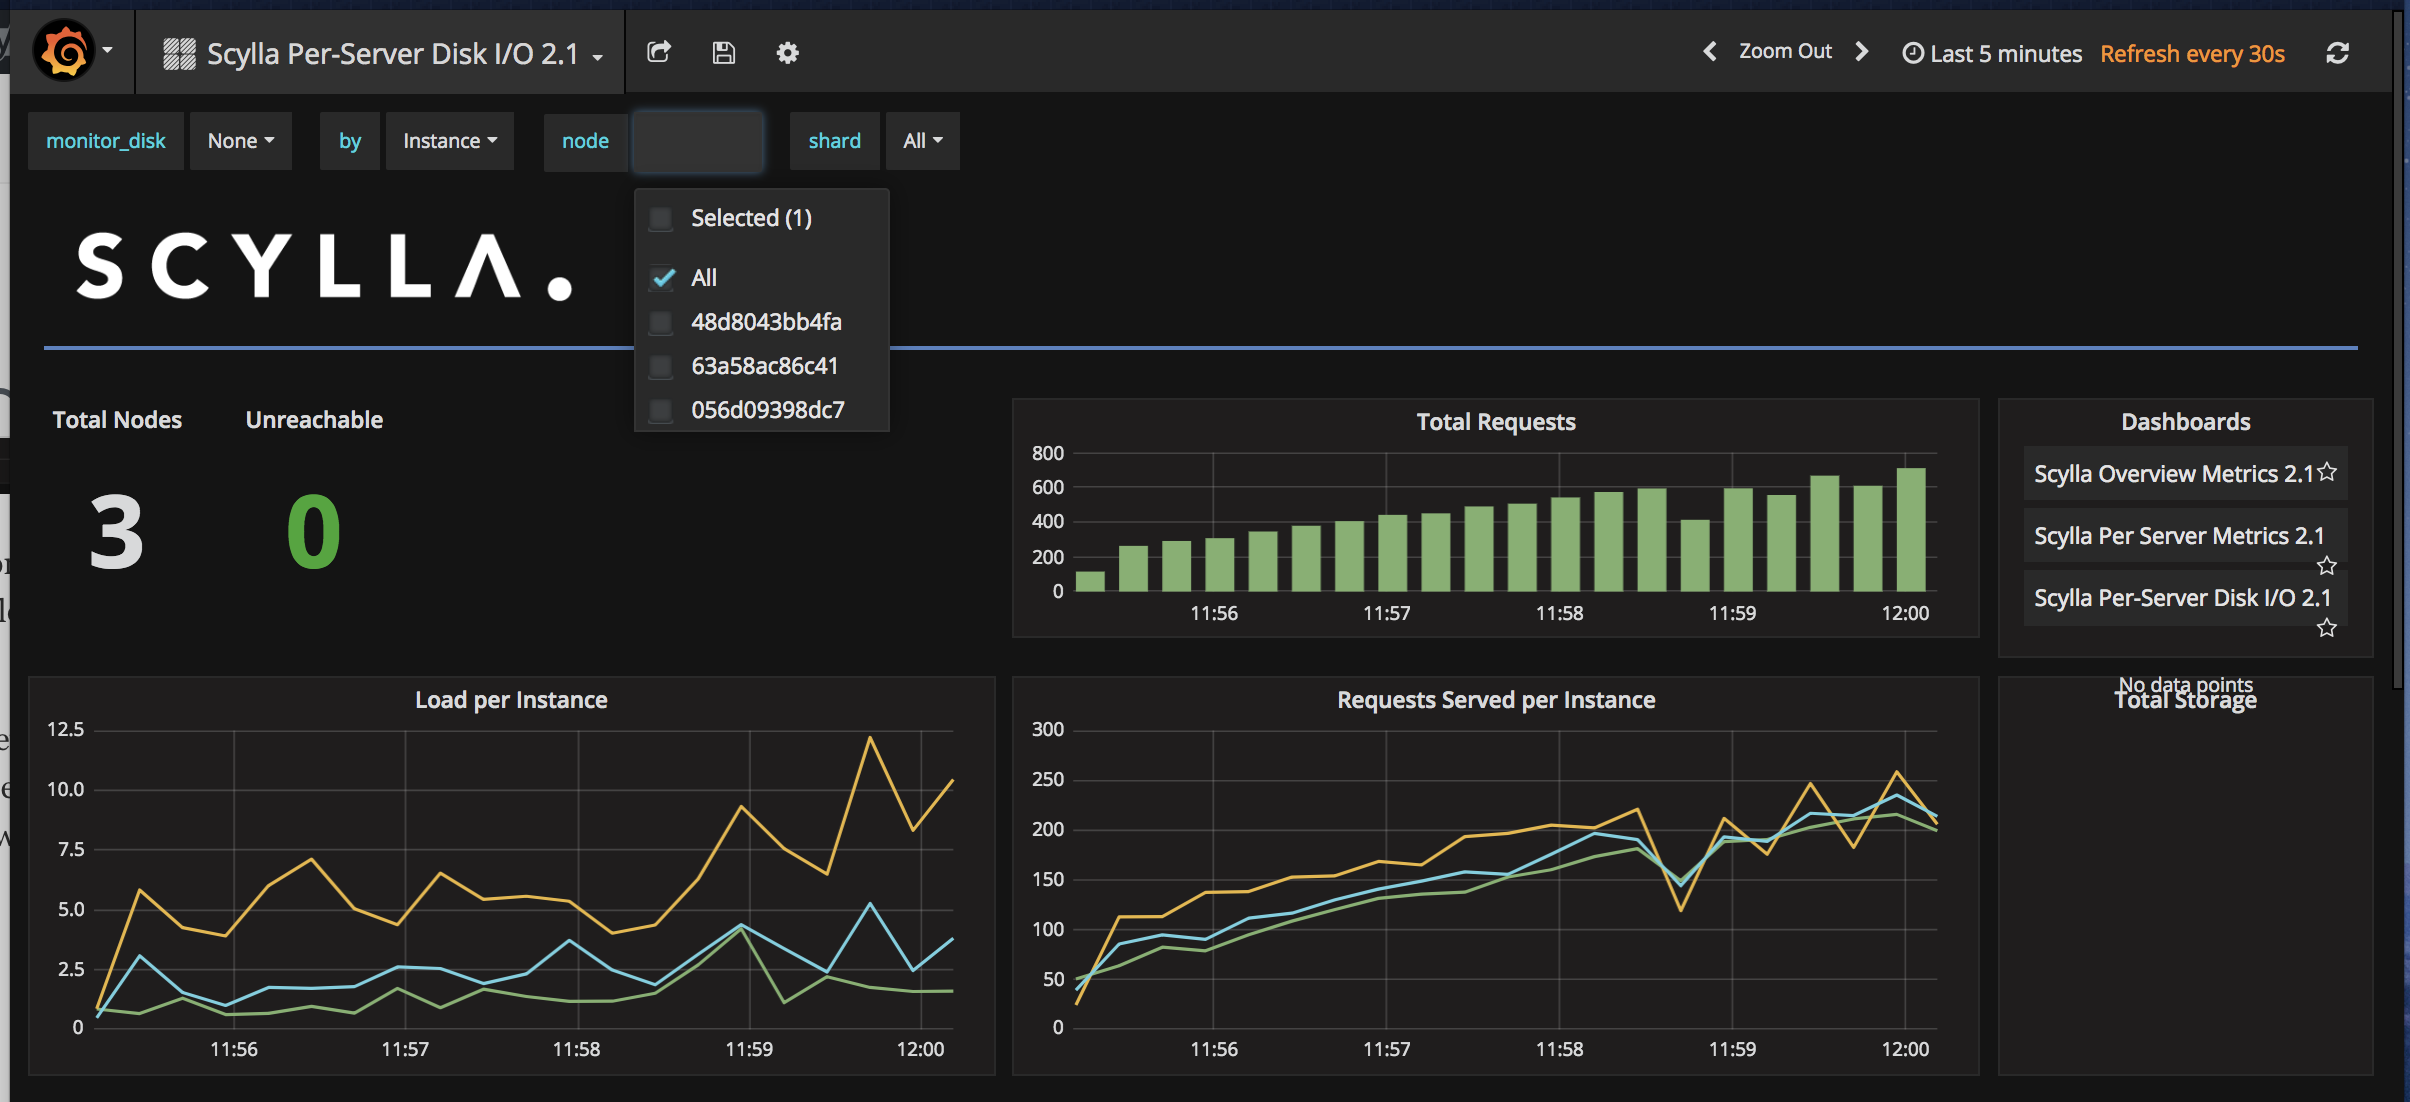
Scylla Monitoring also shows useful information on a per-node basis. To view that dashboard, click on the Grafana logo followed by Dashboards. Next, click Scylla Per-Server Disk I/O 2.1.
From here you can view node-specific details individually or as a cluster. To select more nodes to monitor, click on the node box on the top of the screen and choose ALL or however many nodes you want to view.
Taking Down a Node
Now let’s observe what happens on the dashboard when a node is taken down from the cluster with the following command:
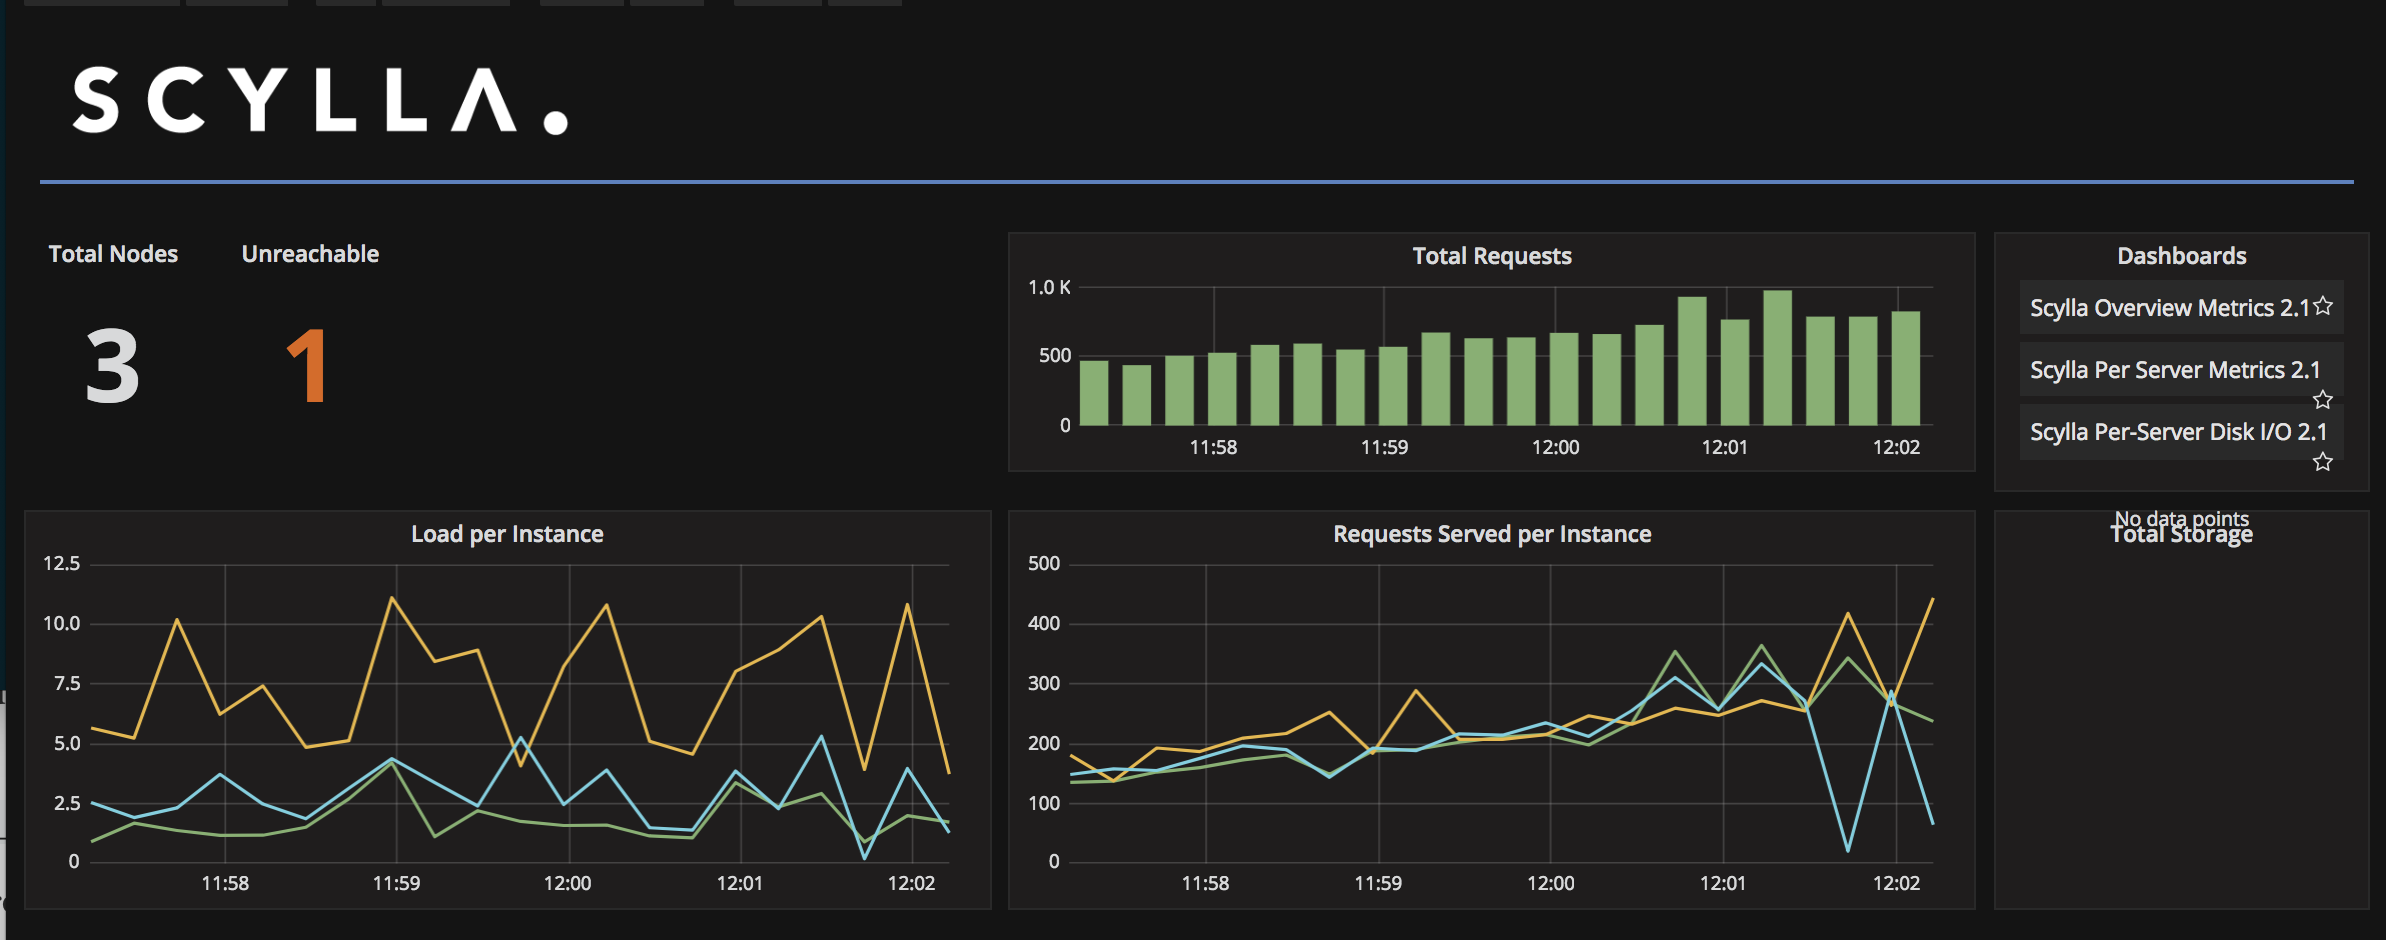
docker pause mms_scylla-node3_1
After a few seconds, we will see that there are still a total of three nodes and one is unreachable.
To bring that node online, run the following command:
docker unpause mms_scylla-node3_1
After a few seconds, there should be no unreachable nodes on the dashboard.
Conclusion
We are now ready at Division 3 to monitor our Mutant Monitoring System using Scylla Monitoring. If a node goes down or performance is becoming an issue, we will be able to quickly see that from the dashboard. In our next installment of the Mutant Monitoring Series, we will discuss how to use a programming language to interact with MMS. Please remain safe out there!
Next Steps
- Learn more about Scylla from our product page.
- See what our users are saying about Scylla.
- Download Scylla. Check out our download page to run Scylla on AWS, install it locally in a Virtual Machine, or run it in Docker.
- Take Scylla for a Test drive. Our Test Drive lets you quickly spin-up a running cluster of Scylla so you can see for yourself how it performs.
The post Mutant Monitoring Systems (MMS) Day 8 – Monitoring appeared first on ScyllaDB.